

Stop googling the average settlement and working backward from it. That popular advice, find a big number online and demand a multiple of your bills, gets personal injury claims payouts wrong in both directions. It overvalues routine claims that carriers pay every day, and it undervalues permanent injuries where future care and lost earning capacity matter more than past bills.
A usable valuation starts elsewhere. Pick a negotiated band for the injury profile, adjust it for proof, fault, and the insurance limit that caps collection, then subtract fees, costs, and liens. The gross figure is an intermediate step. Net usable money, when it arrives and in what form, is the outcome you're really choosing.
Payout Bands by Injury Profile
A viral verdict isn't a working number. Three different figures get mixed up constantly, and separating them is the first valuation step.
First, there's the amount typically paid on a closed claim. That's the negotiated population, mostly modest injuries. Second, there's the median among plaintiffs who receive something. That excludes zeros. Third, there's the median jury award among plaintiffs who win at trial. That excludes settlements and defense verdicts, so it sits far above routine payouts.
On the paid claim side, 2025 summaries of personal injury compensation report that half of plaintiffs received no more than $24,000, with median compensation of approximately $16,000 for motor-vehicle cases, while verdicts exceeding $10 million rose 52% in 2024 and remained atypical. Read those together. The center of the market is five figures. The tail is growing louder, not more representative.
Planning bands, not promises
Use the table to pick a starting row, then adjust. Every figure here is a planning range for negotiation, not a guarantee, a state average, or a trial result. When harm is temporary, negotiators commonly anchor around 1.5 to 3 times medical specials, with wage loss added where it's proved. When harm is permanent, that shortcut breaks down and a life-care plus wage model replaces it.
| Injury profile | Usual anchor | What moves the band |
|---|---|---|
| Minor soft-tissue sprain, short treatment | About 1.5 times specials, plus proved wage loss | Treatment gaps, disputed causation, low bills |
| Whiplash with months of care | About 2x specials plus modest wage loss | Objective findings, consistent care, time off work |
| Simple fracture with full recovery | Specials plus duration of pain and disability | Surgery, hardware, dominant limb, job demands |
| Herniated disc treated with surgery | Specials, future care, and permanency | Fusion versus injection, residual limits, clear liability |
| Mild TBI or prolonged post-concussion | Duration of cognitive and work limits | Neuropsych testing, imaging, symptom diary, prior history |
| Moderate to severe traumatic brain injury | Life-care plan and lost earning capacity | Age, policy limits, share of fault |
| Spinal-cord injury | Lifetime medical care and wage loss | Injury level, attendant care, venue |
| Amputation | Prosthesis replacement cycle and occupation | Dominant side, age, vocational loss |
| Wrongful death | Economic loss to dependents | Earnings, number of dependents, household services |
A fracture row shows why anatomy alone doesn't set value. A personal injury claim for a broken collarbone with a clean heal and a desk job sits low in that band. The same bone with surgery, hardware, and a tradesperson who can't lift overhead moves up fast.
Pick the closest row as a starting band only. Then apply two hard ceilings before you name a number, the available liability limits and any reduction for comparative fault.
Comparative-fault rules and venue differ by state, so check the band against the file's jurisdiction before any figure is set. A band that ignores a fault bar or a low limit isn't conservative or aggressive. It's just wrong arithmetic.
How Specials and General Damages Add Up
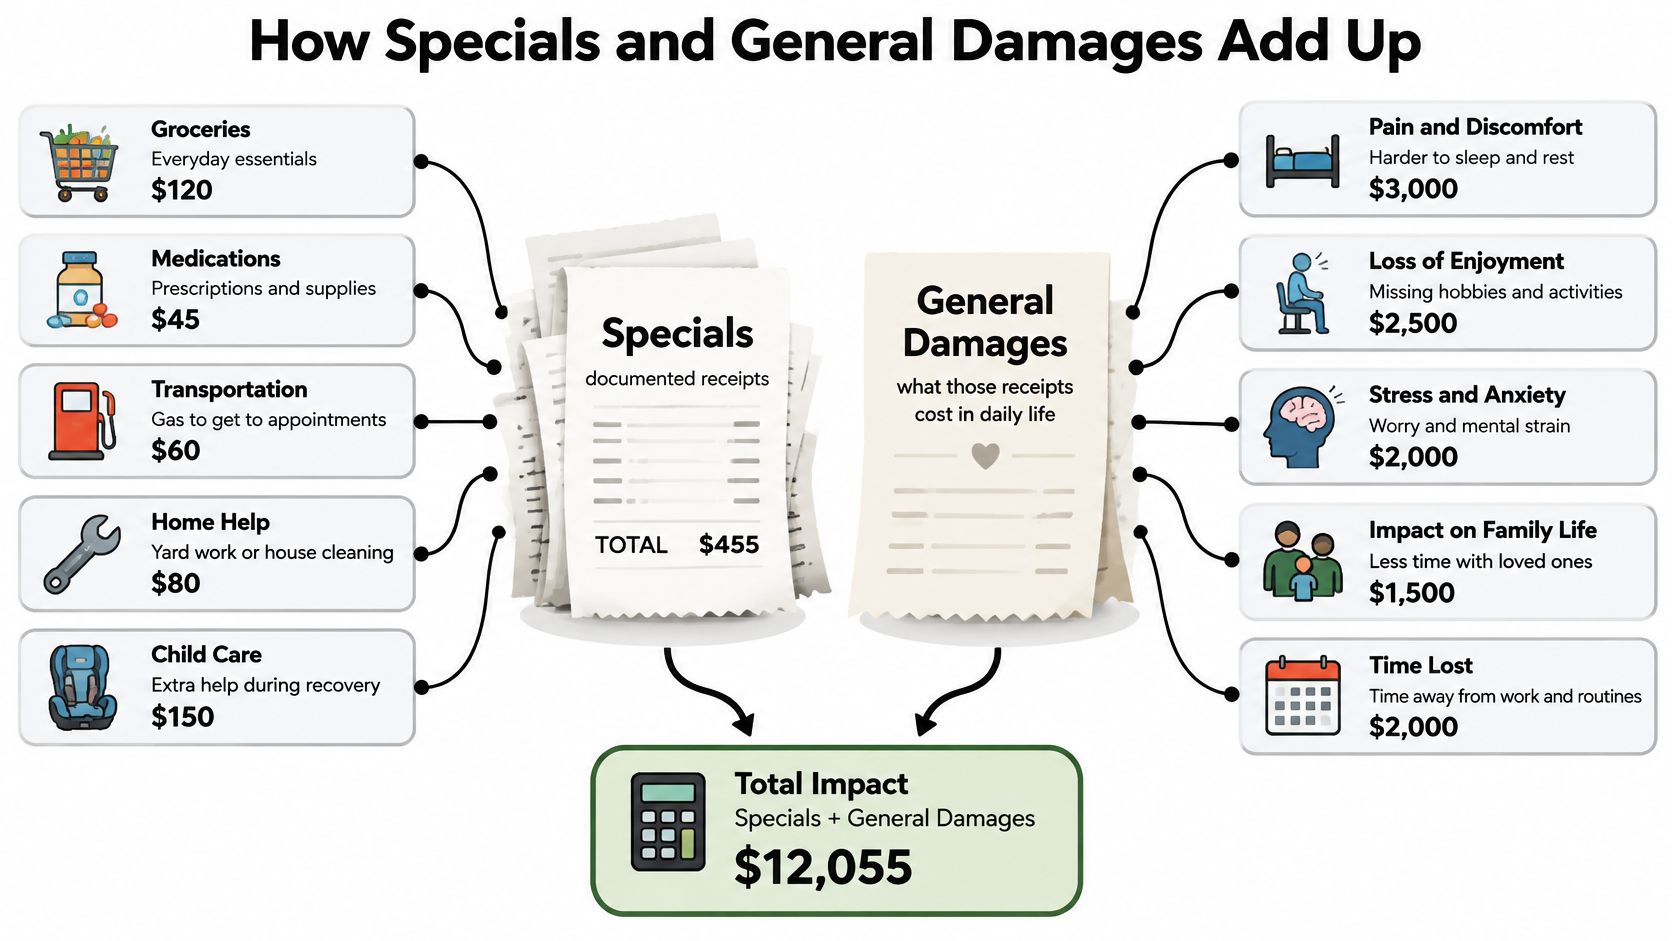
A settlement's gross figure combines documented financial losses with harm that is harder to price. Keep those amounts separate: insurers assess the evidence for each differently, and a combined total can hide weak support.
The chart shows how specials and general damages contribute to the overall claim.
The economic pile
Build the economic damages total in a consistent order, keeping each category distinct so amounts are not counted twice.
- Billed versus paid: Record billed charges and amounts paid on separate lines. The difference can become a point of negotiation, so show the underlying figures rather than blending them.
- Future medical care: Include a projection only when it has a basis, such as a treating provider's plan, expected frequency, and unit cost. An unsupported round figure gives the insurer little reason to accept it.
- Past lost wages: Support the amount with employer records showing the pay rate, hours missed, and any paid leave used.
- Loss of earning capacity: Use this category when the person cannot return to the same work. It concerns vocational impact and future earnings, not a larger past-wage total.
The non-economic pile
General damages address physical pain, limits on ordinary activity, emotional distress, scarring or disfigurement, and loss of consortium where that claim exists. Duration and documented effects on function carry more weight than adjectives. A symptom diary linked to treatment dates helps show how limitations persisted.
The multiplier method estimates general damages as a multiple of specials. It describes a valuation approach, not a binding formula. The Insurance Research Council study of more than 7.4 million U.S. auto-injury claims covered claims closed with payment between mid-2017 and mid-2022. It found average bodily-injury payments rose at an annualized rate of 7.8%, from approximately $14,000 to more than $20,000, faster than medical-care inflation. The study also reported that the settlement-to-medical-bills ratio rose from approximately 1.80:1 to more than 2.30:1 over the study period.
That ratio describes a broad claims population, not a guaranteed multiple for an individual file. The rise also indicates that medical prices alone did not account for the change in payments. For a case valuation, the quality of the evidence and the specific damages remain more useful than applying an average mechanically.
Use a per-diem calculation only as a cross-check: multiply a daily rate by the days of meaningful limitation. Do not average that result with a multiplier estimate to create another figure. If the methods produce sharply different results, examine the duration evidence and the specials base.
Present four separate lines in the demand: billed charges, paid medical amounts, future care, and non-economic harm. This layout makes the assumptions visible and lets the parties assess each part of the gross demand before considering what the claimant may ultimately receive.
Why Trial Medians Are Not Settlement Averages
Cases that reach a verdict have passed through a selection process. They are disputes that remained unresolved, often because liability, causation, or value was contested. Their awards describe winners at trial, not the broader pool of claims that settle.
The Bureau of Justice Statistics tort-trial report for fiscal years 2002 to 2003 counted approximately 512,000 civil cases, including 98,786 tort cases, nearly 20% of the civil caseload. About 9 in 10 tort trials involved personal-injury issues, most commonly motor-vehicle accidents, product liability, medical malpractice, and marine cases. Plaintiffs prevailed in 48% of tort trials. Among plaintiff winners, 84% received monetary damages. The estimated median award was $201,000 across all tort trials, $181,000 for personal-injury tort trials, and $164,000 in motor-vehicle cases.
These are fiscal 2002 to 2003 federal data, the oldest benchmark here. Recent closed-claim averages and plaintiff summaries are more relevant as current benchmarks. The federal figures help show how trial selection affects awards, not what a claim should settle for today.
Label every population
| Figure | Population counted | Anchor | Do not use it as |
|---|---|---|---|
| Broad motor-vehicle median | 2025 summaries of compensation | About $16,000 | The value of a surgical or catastrophic case |
| Share at or below $24,000 | 2025 plaintiff summaries | About half of plaintiffs | Proof that serious cases are small |
| Plaintiff win rate | US tort trials, FY 2002 to 2003 | 48 percent | A settlement probability for a clear-liability claim |
| Median all tort trial award | Winning tort plaintiffs, FY 2002 to 2003 | $201,000 | An average of all claims including settlements |
| Median personal-injury trial award | Winning plaintiffs at trial, FY 2002 to 2003 | $181,000 | The average of all claims including settlements |
| Median motor-vehicle trial award | Winning motor-vehicle trial plaintiffs, FY 2002 to 2003 | $164,000 | A typical pretrial insurance check |
These figures distinguish populations, not injury categories by severity. The table reports trial medians for tort and motor-vehicle cases; it does not establish medians for medical-malpractice or product-liability cases. Combining unlike claims into one average can obscure differences in injury, proof, and coverage.
Expected value rule: Probability of proving liability times a damages range, minus time and cost, is the negotiation number.
A 48% win rate means a winners-only median leaves out the chance of receiving no award at trial. Quoting $181,000 without discounting for that possibility overstates the likely recovery. And even a carefully adjusted trial figure is only one input: a negotiated range still depends on the case's proof, fault, and available insurance limits.
Three Sample Comps From Bills to a Range
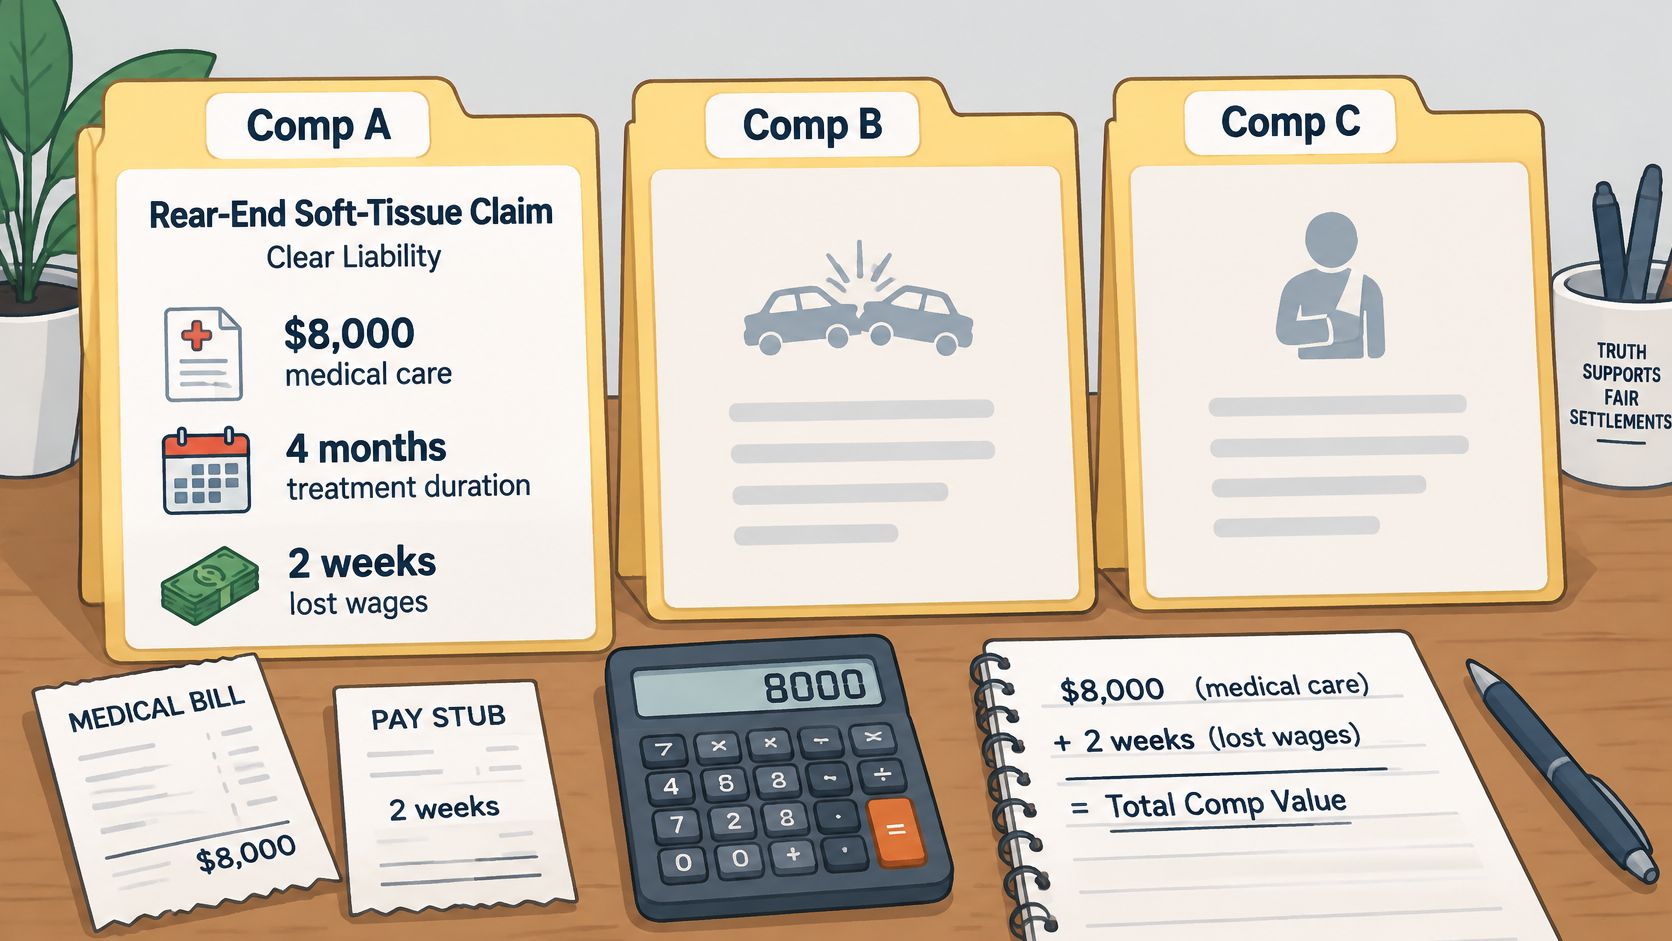
Worked files beat abstract ranges. The image below shows the raw material these comps start from, folders of records and a calculator, before any number is defensible.
Comp A, rear-end soft tissue
Say liability is clear. Paid medical care is $8,000 over four months with no gaps, and the claimant missed two weeks at $1,500 a week. Apply a 2.0 multiplier to specials for pain and activity limits, giving $16,000, then add $3,000 in wages. You land near $19,000 gross.
Now stress it. A prior similar strain or a six-week treatment gap pulls the multiplier toward 1.5, and the gross drops toward the low teens. Nothing about the diagnosis changed. The proof did.
Comp B, lumbar disc with surgery
Paid medical is $80,000, supported future care is $40,000, and past wage loss is $25,000. Don't multiply that whole stack by 2. Price permanency and residual work limits as their own general-damages range instead, which supports a demand band around $250,000 to $350,000 only if liability is clean.
Then apply collection reality. If a $100,000 policy is the only coverage, the collectible number is $100,000 regardless of how strong the band looks on paper.
The short video below walks through settlement calculation mechanics that sit behind these comps.
Comp C, same disc, disputed fault
Keep Comp B's medical facts and make fault roughly even odds. Expected value is about half the likely award, minus the cost of delay while the defense litigates. A mid-five-figure settlement can beat a theoretically larger verdict that has a real chance of returning zero.
| Comp | Inputs | Method | Result |
|---|---|---|---|
| Comp A, rear-end soft tissue, clear liability | $8,000 paid medical, $3,000 wages | 2.0 times specials, plus wages | About $19,000 gross |
| Comp B, lumbar disc with surgery, clean liability | $80,000 paid, $40,000 future care, $25,000 wages | Permanency priced separately, not 2 x the whole stack | $250,000 to $350,000 demand band |
| Comp B with a $100,000 policy only | Same facts | Collectible cap applied to the demand | $100,000 maximum |
| Comp C, same disc facts, fault near even odds | Same inputs | About half the collectible figure, less defense delay | Mid-five figures settlement |
To run your own file, swap in five inputs, paid versus billed medical, wage proof, permanency, fault share, and the smallest applicable limit. Each comp above stops at gross value, before liens and fees.
Net Recovery Timing and Payment Form
A settlement headline is not the amount a claimant can spend. Fees, case costs, reimbursement claims, and funding charges all reduce the check, so compare offers by net recovery and when the money arrives.
The chart applies those deductions to Comp A at $19,000 and Comp B capped at $100,000.
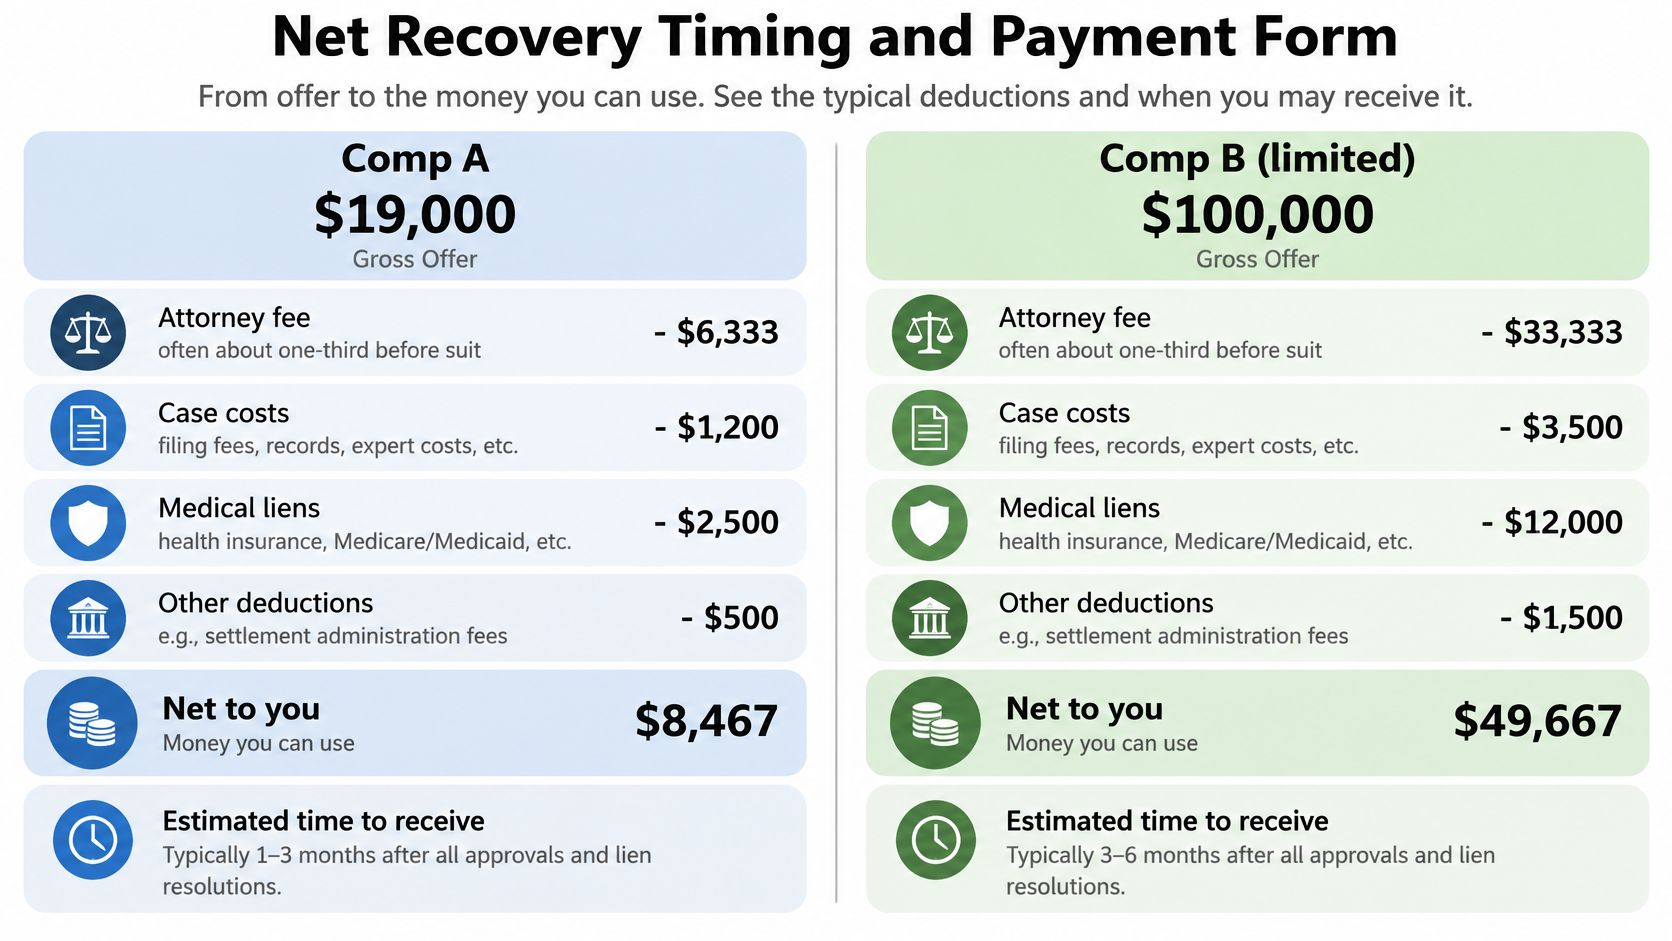
Start with the attorney fee, often about one-third before suit and closer to 40 percent in litigation. Subtract case costs, health-plan or Medicare reimbursement under a medical lien, and any litigation-funding charges, which increase as a case runs longer. On Comp A, a one-third fee alone removes roughly $6,300 from the $19,000 gross, before costs or reimbursement.
A larger offer can still produce less usable money. An offer that is $10,000 higher but arrives a year later, after a higher fee tier and accumulating funding charges, may net less than the smaller offer today.
Timing and form change value
UK actuarial material on settlement performance reports an average settlement time of roughly 350 days in that market. The figure is specific to the UK, but it illustrates why timing belongs in a valuation: months without payment can leave bills and lost wages unpaid. Many claimants may also find a fixed monthly payment schedule easier to budget around than a single lump sum.
| Question | Lump sum | Structured annuity |
|---|---|---|
| When funds arrive | One payment after liens, fees, and release | Periodic payments over an agreed term |
| Budgeting | One payment requires the claimant to manage spending over time | A fixed schedule can make budgeting easier |
| Fits best | Debts, lien payoff, or a single large expense | Long future care or replacement of wages |
| Main risk | Spend-down and investment results left to the claimant | Insurer payment strength, and inflation if payments are not indexed |
| Negotiation role | Simpler number and release | Can settle a gap when monthly need matches but gross dollars differ |
A lump sum can suit pressing debts, a lien that must be cleared, or a one-time medical expense. A structure may fit long-term care or wage replacement, and can help close a negotiation when the monthly need matches even if the headline amounts differ.
Tax treatment is usually favorable for physical-injury compensatory damages, but fees and liens still reduce what remains. Compare each offer on one line: gross, minus fee, costs, liens, and funding, timed to when cash is needed.
Proof, Demand Timing, and the Decision
Send a policy-limits demand only when liability, causation, permanency, and the limit itself are all visible in one package. A demand sent earlier doesn't look aggressive. It looks unpriced.
Empirical research on closed Texas personal-injury claims involving physician defendants found approximately 20% of cases settled at 90 to 100% of policy limits and 13% settled exactly at limits, and those at-limits cases closed about five months faster, roughly 20% shorter from suit to settlement, with substantially lower defense costs. Virtually all physician-defendant cases settling at limits were preceded by an at-limits demand, and payouts above limits were uncommon.
Read that carefully. The demand didn't create value. It made existing exposure technically legible, and legibility changed the carrier's incentives on both price and speed.
Build the package in sequence
Order matters, because each element depends on the one before it.
- Liability facts first: Establish what happened and why the defendant is responsible, with documents rather than assertions.
- Medical chronology second: Link pre-incident baseline, objective findings, treatment escalation, permanency, and functional loss to the event, date by date.
- Damages third: Present paid medical, a wage letter, and a future-care estimate a doctor will sign.
- Coverage last: Name the specific limit you're targeting and show why the documented exposure reaches it.
Diagnostic tests outweigh pain complaints alone. An MRI finding that matches the symptom pattern, or neuropsychological testing that quantifies a cognitive deficit, gives an adjuster something to reserve against. Unexplained treatment gaps do the opposite, so close them first, either with a documented reason or by resuming care before you demand anything.
A limits demand without that sequence trains the carrier to ignore the next one.
Firms can use an AI review tool such as Ares to turn uploaded records into a dated chronology and a demand draft. That saves assembly time. A lawyer still has to check causation and every number before the package goes out, because a clean-looking chronology with a weak causation link is worse than a messy one that's right.
Lock three figures before naming a number
Don't open negotiations with one number. Lock three.
- Gross band after fault and limits: The collectible range, not the theoretical verdict range.
- Net after deductions: Fee, costs, liens, and funding subtracted in order.
- Payment form: Lump sum or structured, matched to when the client needs cash.
If any of those is unknown, you're guessing. Gather paid and billed medical totals, a wage record, a gap-free symptom timeline, limits for every defendant, and a written lien estimate instead of anchoring on a headline verdict. Each missing item maps to a specific discount the carrier will apply.
Injured people should bring those documents to counsel before negotiating alone with an insurer. Adjusters negotiate against files, not against stories, and the file you're missing is the discount you're accepting.
If your team is still building chronologies by hand before it can price a file, Ares turns uploaded medical records into dated chronologies and demand drafts you can check, edit, and send. Upload the records for one active case, compare the resulting timeline against your own notes, and see how much sooner you can lock the gross band, the net, and the payment form.