

A $75,000 median recovery sounds like a useful answer to the question, “What is the average personal injury lawsuit settlement?” It is useful, but only when read correctly. Westlaw Edge analyzed 745 U.S. federal personal-injury cases filed between 2013 and 2022 that ended in a publicly documented settlement or award. The median recovery was $75,000, yet more than 40% of plaintiffs received $5,000 or less (Nolo's analysis of personal injury recoveries).
That contrast exposes the central valuation problem. A single arithmetic average can be pulled upward by catastrophic injuries, while public databases often overrepresent cases important enough to be reported. Attorneys need medians, percentile bands, case-specific evidence, and a clear separation between gross settlement and net client recovery.
What to Expect from an Average Personal Injury Lawsuit Settlement
There isn't one scientifically reliable national average. Settlement amounts are often confidential, publicly documented cases tend to be selective, and catastrophic claims can distort an arithmetic mean. The $75,000 median from the Westlaw Edge sample is therefore more informative than a headline average, but it still isn't a prediction for an individual client (Nolo).
A separate 2017 Nolo reader survey reported that 67% received compensation through settlement. More than half of those who received money obtained between $3,000 and $25,000, while the reported overall average recovery was $52,900. Because 26% received more than $25,000, the survey's average was influenced by higher-value claims and should be treated as a descriptive benchmark, not an expected result (Nolo survey data).
Gross value is not client recovery
The gross settlement is the amount negotiated with the defendant or insurer. The net recovery is what remains after attorney fees, litigation expenses, medical liens, reimbursement obligations, and other deductions. Historical research summarized in Judge and Jury found that approximately 46 cents of every dollar of tort awards reached the injured party, while legal fees and administrative or distribution costs consumed the balance (Independent Institute summary of Judge and Jury).
That historical figure isn't a fee estimate for every modern case. It does establish a valuation discipline: never present gross settlement value as if it were the client's final check.
Practical rule: Give clients a range for gross recovery and a separate estimate for net proceeds under realistic fee, cost, lien, and reimbursement assumptions.
Case severity, liability proof, medical documentation, lost income, permanency, available insurance, jurisdiction, and the quality of future-loss evidence all influence the range. Attorneys who want to help prospective clients understand the process can also direct them to find a personal injury lawyer, while keeping the valuation conversation grounded in evidence rather than advertising claims.
Typical Settlement Ranges by Case Type and Severity
Among publicly aggregated settlement benchmarks, one of the more useful starting points is distribution data from 60,820 settled car-accident cases, which shows a $24,000 median and a middle half between $8,000 and $58,000 (settled car-accident data aggregation). For intake and early case screening, percentiles give attorneys a better anchor than a single headline outcome because they reduce the distortion created by unusually large recoveries.
That matters when lawyers discuss what is "typical." A short-course soft-tissue case with limited treatment, quick resolution, and disputed causation usually belongs near the lower part of a distribution. A fracture with surgery, extended rehabilitation, or lasting work restrictions belongs in a different severity tier. Cases involving permanent impairment, reduced earning capacity, or long-term care needs should be valued against a more severe claim population, not against the full universe of routine injury settlements.
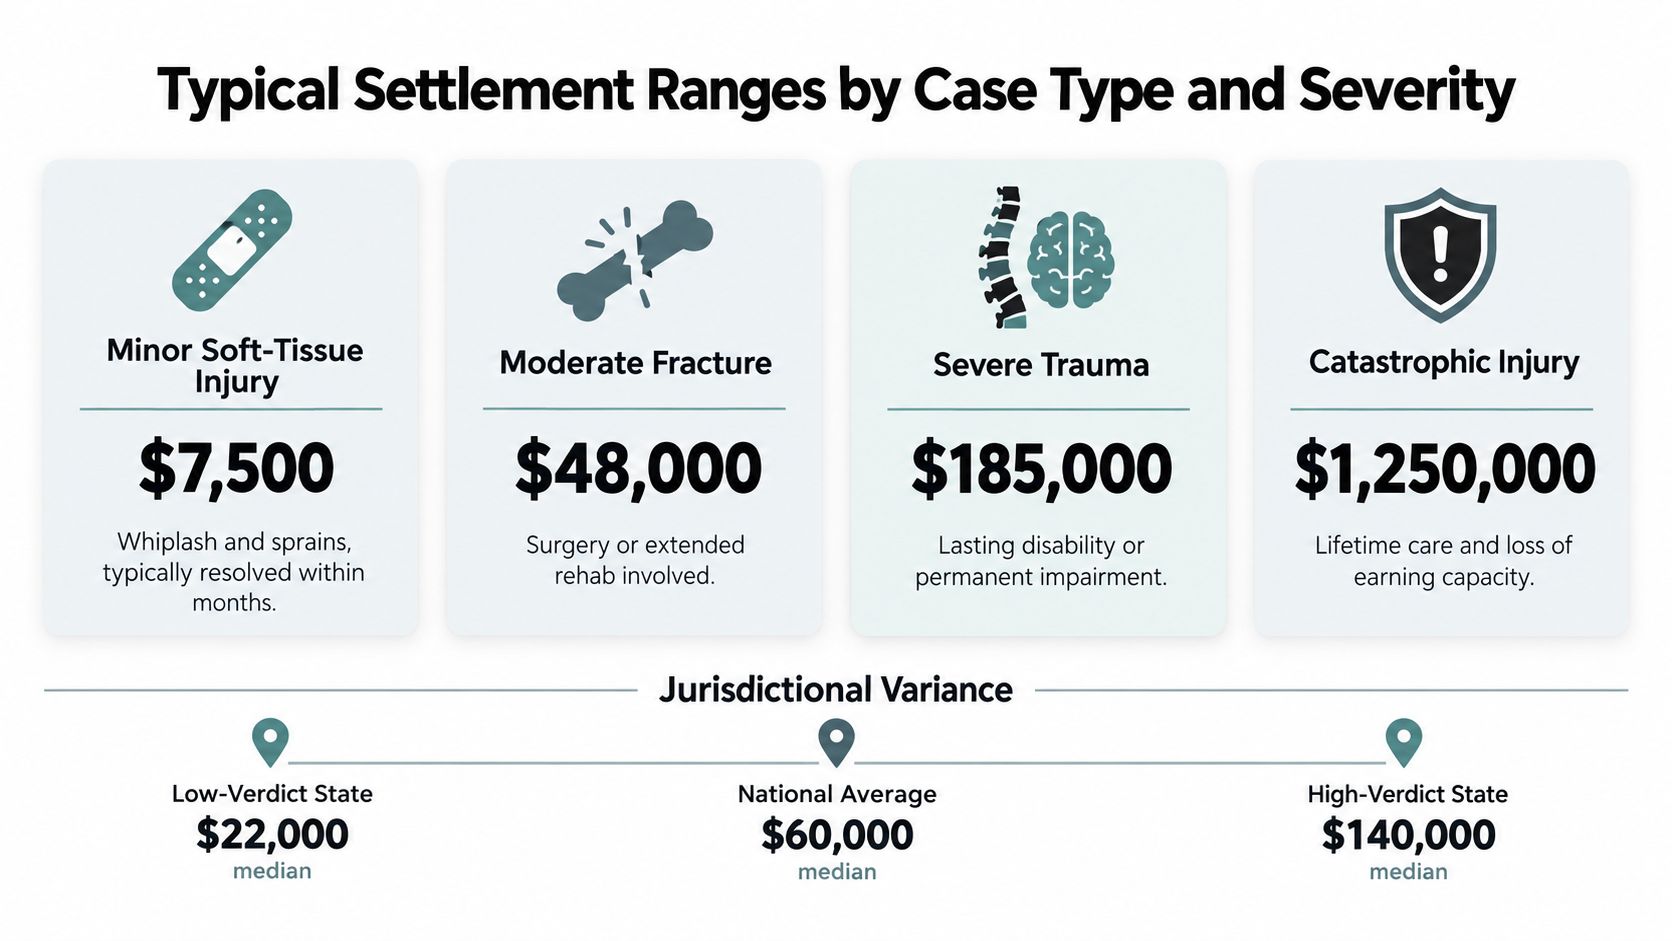
Read ranges by claim population
Before using any benchmark with a client, attorneys should test whether the underlying pool actually matches the file:
- Filed lawsuits: These often skew toward more serious, contested, or higher-value matters than the wider universe of insurance claims.
- Publicly reported results: Publication tends to favor unusual, severe, or unusually large outcomes, which can bias expectations upward.
- Settled claims: These often provide a broader benchmark than trial reports, but confidentiality still limits how complete the picture is.
- Claim type: Auto collisions, premises liability, malpractice, and catastrophic injury claims should not share one baseline.
- Severity tier: Temporary injuries and permanent impairments involve different damages models, proof burdens, and settlement risk.
Medical malpractice shows why type-specific benchmarks matter. Historical tort research has shown that settlement levels can shift materially over time as legal rules, litigation incentives, and cost structures change (historical tort research). The practical takeaway is narrow but important. Older malpractice figures may illustrate volatility within that case category, but they are not a current settlement predictor for an unrelated injury claim.
Jurisdiction changes the usable range too. Liability rules, damages limits, policy limits, jury behavior, and litigation cost all affect where a comparable case may settle. The best practice is to start with a percentile band drawn from a similar claim population, then evaluate likely gross value and likely net recovery separately. That avoids the common error of importing a catastrophic published result into a modest-treatment case because both arose from the same broad accident label.
Core Factors That Drive Settlement Value
The gap between a headline settlement and a usable valuation often comes down to structure. Lawyers need to separate likely gross value from likely net recovery, then test that range against case-specific facts instead of relying on a simple bills-based multiplier.
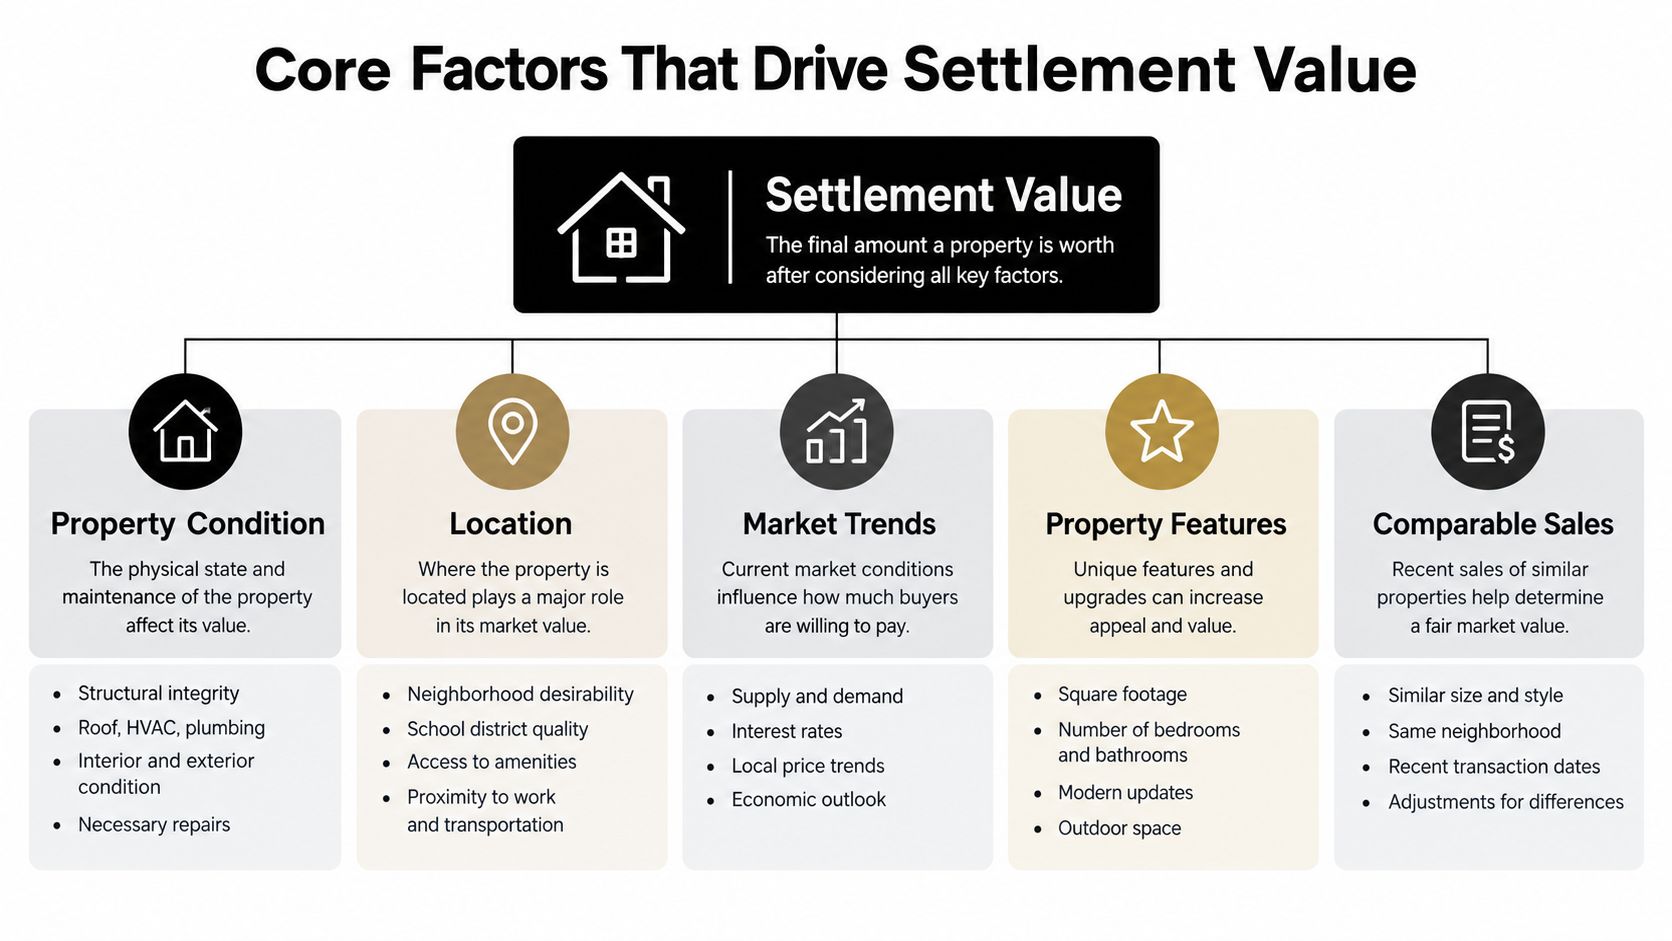
The evidence behind the number
Injury severity and permanency set the upper boundary of value. The question is not only how much treatment occurred, but whether the record shows objective injury, lasting limitations, work restrictions, future care, or a durable loss of function. Those factors usually matter more than a raw total for emergency care, therapy, or imaging.
Liability evidence changes expected value because it changes the odds of collection. Clear photos, witness statements, vehicle data, maintenance records, and admissions can tighten the settlement range. Disputed fault widens it. Even a well-documented injury can settle lower if comparative negligence gives the defense a credible argument for reducing damages.
Medical expenses still matter, but mainly as one benchmark among several. An auto-insurance study covering more than 7.4 million bodily-injury claims closed with payment between mid-2017 and mid-2022 found average payments increased from about $14,000 to more than $20,000, and total settlement value averaged about $2.00 for every $1.00 of medical bills paid, rising above $2.30 by 2022 (Insurance Research Council study coverage). That does not create a universal formula. It does show why percentile-based benchmarking works better than borrowing a single average. The same medical spend can produce very different outcomes depending on causation proof, treatment credibility, policy limits, and impairment evidence.
Lost income and future earning capacity can shift a case out of an ordinary settlement band. Past wage loss is usually document-driven. Future loss depends on stronger proof, including medical support for restrictions and a credible theory of reduced work capacity.
Jurisdiction and insurance limits translate legal merit into collectible dollars. A strong liability case with serious damages may still settle at or near available coverage if no larger recovery source exists. By contrast, broader coverage can raise practical value even where treatment totals look modest.
Historical tort research, as noted earlier, also supports keeping gross and net analysis separate. A case can present well on paper and still return far less to the claimant after fees, costs, liens, and collection limits. That is why sound valuation uses both a probable outcome range and a realistic net-to-client range, rather than a headline settlement figure alone.
How to Estimate Your Case Value
A defensible valuation begins with a clean factual record. The objective isn't to manufacture a number. It's to show how each component of the proposed range follows from evidence, legal risk, and collection constraints.
Build the medical and liability foundation
Start by creating a dated medical chronology. Record the incident, first complaint, diagnoses, imaging, procedures, therapy, medication changes, provider opinions, symptom progression, work restrictions, gaps, and discharge or prognosis statements. Separate billed charges from paid amounts and identify which treatment providers connect the condition to the incident.
Next, test causation and liability independently. A large medical total doesn't cure a weak causal link, and clear fault doesn't establish the extent of injury. Assemble the incident evidence, identify adverse facts, assess comparative-fault risk, and investigate every potentially applicable policy.
Quantify historical and future losses
Calculate past medical expenses and wage loss from source records. Then determine whether the medical evidence supports future treatment, permanent impairment, reduced work capacity, or none of those claims.
Forensic economic analysis commonly incorporates life expectancy, work-life expectancy, past and future earnings, personal-consumption offsets, inflation, productivity growth, and a discount rate to convert projected losses into present value (forensic economic analysis). Each assumption should connect to evidence. Medical opinions support restrictions and prognosis, payroll or tax records support earnings, vocational evidence addresses employability, and an economist explains the present-value calculation.
Construct a range, then adjust it
Use a comparable median and percentile band as an external reference point. Adjust the starting range for:
- Liability probability, including disputed facts and comparative fault.
- Injury permanence, objective findings, treatment continuity, and functional impact.
- Past and future economic losses, with assumptions stated separately.
- Insurance and collectability, including policy limits and other coverage.
- Venue and procedure, including jurisdictional rules and litigation cost.
- Evidence quality, including missing records, inconsistent histories, and expert support.
A useful internal worksheet should show low, central, and high scenarios rather than one false-precision figure. For practical guidance on a related vehicle claim assessment, attorneys can consult how much an auto accident may be worth, then tailor the analysis to the actual file.
Negotiation Strategies to Maximize Settlements
Settlement results often turn on net recovery, not the headline demand. A negotiation strategy should test how each move affects gross value, deductions, delay, and the probability of collection, because a larger nominal number can still produce a weaker client outcome.
Start by organizing the file around the insurer's actual decision points. Present liability, causation, damages, coverage, and trial exposure in one record so the adjuster or defense counsel can price risk without filling gaps in your favor. A concise liability presentation still matters, but its function is tactical. It frames the dispute before the carrier reduces the case to a bill-driven exchange.
Turn records into a damages narrative
Medical records become more persuasive when they explain sequence and function, not just treatment volume. The summary should connect the event to the first complaint, account for any treatment gap, identify objective findings, and separate temporary symptoms from ongoing restrictions. Future care needs their own analysis because projection requires medical support, not just a stack of past invoices.
That distinction matters in negotiation. As the Insurance Research Council findings discussed earlier show, bills are one input, not a multiplier. If the insurer responds with a formula tied too closely to charges, answer with the evidence that changes case position: diagnostic support, consistent histories, work restrictions, daily-life limits, and prognosis. The point is to show why this claim belongs higher or lower within a range, not to argue over arithmetic.
Use timing and scenario analysis
Timing changes bargaining power. Sending a final demand before treatment stabilizes can compress value because unresolved prognosis makes both future losses and defense arguments harder to assess. If the record is still developing, identify the missing proof and the reason early compromise would shift uncertainty to the claimant.
Scenario analysis keeps that decision disciplined:
- Early resolution: Lower transaction cost and faster payment, with more risk that later losses were discounted too heavily.
- Mediation or structured negotiation: More record development and expense, with a better setting to test disputed liability or causation points.
- Trial preparation: Higher cost and longer delay, but more pressure on the defense to value uncertainty accurately.
Use those scenarios to compare expected gross recovery with expected net recovery after fees, liens, expenses, and time. Attorneys who want a practical framework for demand positioning can review how to negotiate a personal injury settlement and adapt it to the venue, the evidence, and the client's risk tolerance.
Real-World Settlement Scenarios and Insights
Using the 60,820-case aggregation cited earlier, the $24,000 median and $8,000 to $58,000 middle range offer a useful benchmark for car-accident claims. They are most useful as distribution markers, not as a preset outcome for any single file. A low-impact motor-vehicle case with brief treatment, visible vehicle damage, and no documented permanent restriction may belong near the lower end of that observed range, while stronger proof can shift placement upward.
A contested premises case follows a different valuation logic. Injury evidence may be persuasive, yet expected value can still fall if surveillance, notice disputes, comparative fault, or an alternative cause weaken liability. In that setting, the practical question is not the headline average. The stronger question is where the file belongs within a comparable distribution once liability risk is priced in.
Soft-tissue cases with symptoms that continue past the initial treatment period often expose the gap between gross and net expectations. Past medical expenses are usually easier to document than future care, so projected treatment needs more than a general recommendation. Attorneys improve demand credibility by tying future care to a provider opinion, connecting lost income to employment and vocational support, and separating confirmed losses from forecasted ones. That discipline also reduces the chance that a large opening demand creates unrealistic client expectations about net recovery after deductions.
Evidence quality can change posture quickly.
For teams handling surveillance or other audiovisual material, a practical guide on video evidence for legal teams can help organize questions about authenticity, chronology, preservation, and presentation. Video becomes more useful when it is connected to liability analysis and medical proof rather than offered as a stand-alone exhibit.
Across all three scenarios, percentile-based thinking keeps valuation grounded. Calculate gross settlement value and net recovery separately. Fees, costs, liens, and medical reimbursement can materially change client outcomes, so the most favorable result may be the one that produces the strongest net position, not the highest headline number.
Putting It All Together for Better Settlement Outcomes
A reliable settlement process follows a short sequence: choose comparable data, use medians and percentile bands, classify severity, test liability, document medical chronology, quantify historical and future losses, investigate coverage, and model gross versus net recovery. The resulting range should show assumptions, uncertainty, and the evidence needed to move the file from one scenario to another.
Firms should also treat documentation quality as an operational priority. A structured medical chronology, organized exhibits, and a clear demand narrative make the valuation easier to audit and the negotiation easier to explain. For broader client-acquisition and visibility planning, attorneys can consult this law firm SEO guide from Netco Design LLC.
The practical conclusion is simple: don't promise an average. Give clients a transparent range built from comparable distributions and file-specific proof.
Ares helps personal injury firms review medical records and draft settlement demands by organizing diagnoses, treatment dates, providers, symptoms, causation details, and damages into case-ready summaries. Visit Ares to see how your team can apply a more consistent gross-to-net valuation workflow while reducing manual file review.