
Most routine auto injury claims resolve in the tens of thousands, with a widely cited median around $31,000, while represented claimants have been reported at $77,600 on average compared with $17,600 for unrepresented claimants. That means your case probably isn't defined by one magic number. It falls somewhere in a range shaped by your injuries, your proof, your share of fault, and the insurance money available.
After a crash, many drivers do the same thing. They search how much is my auto accident worth, see a few wildly different numbers, and get more confused than before. One site says average. Another says multiplier. A third makes it sound like every sore neck claim should settle like a surgery case.
That's not how real valuation works.
A claims adjuster, case manager, or attorney doesn't start with a headline number and work backward. They start with facts. What treatment did you get? How quickly did you get it? Do the records match your symptoms? Is liability clear? Are there policy limits? Is there anything in the file that gives the insurer room to discount the claim?
Those details can pull a case up or push it down fast. Even your recovery plan matters. If you're still looking for conservative care or pain relief for accident injuries, that treatment history can become part of the record that later supports the claim.
What Your Auto Accident Is Really Worth Right Now
On paper, people want a price tag. In practice, a car accident claim is a valuation range.
One person has an ER visit, a few weeks of physical therapy, and a full recovery. Another has the same rear-end crash, but their records show persistent symptoms, missed work, follow-up imaging, and a much longer treatment course. To the outside world, those crashes look similar. To an insurer, they are not.
A useful starting point comes from current settlement benchmarks. A 2023 Insurance Research Council-based summary places the median settlement amount at about $31,000 for auto injury claims, while another survey-based estimate puts the typical overall payout near $23,900. The same summary reports $77,600 for represented claimants versus $17,600 for unrepresented claimants. Those figures are collected at Fair Settlement's accident statistics summary.
Why online averages often mislead
An average can be dragged up by severe injury cases. A median often better reflects what a more typical claim looks like. Neither one tells you what your claim is worth.
Your case can land below those benchmarks if:
- The injury is minor and resolves quickly.
- Treatment gaps appear in the records.
- Fault is disputed.
- Insurance limits are low.
It can land above them when:
- Medical care is substantial and well documented.
- Symptoms are consistent across providers.
- Future treatment is likely.
- Permanent effects show up in the records.
The most common mistake I see is treating valuation like a fixed formula instead of a negotiation built on proof.
Why newer claims may value differently than older examples
Older articles often anchor readers to stale numbers. But claim values have moved.
Industry reporting citing Insurance Information Institute data says the average paid bodily-injury liability claim reached $28,278 in 2024, and the average property-damage claim reached $6,770. The same reporting notes bodily-injury claim costs have risen sharply over time, which is why older settlement examples can understate newer claims. You can see that market context in this car accident settlement calculator discussion.
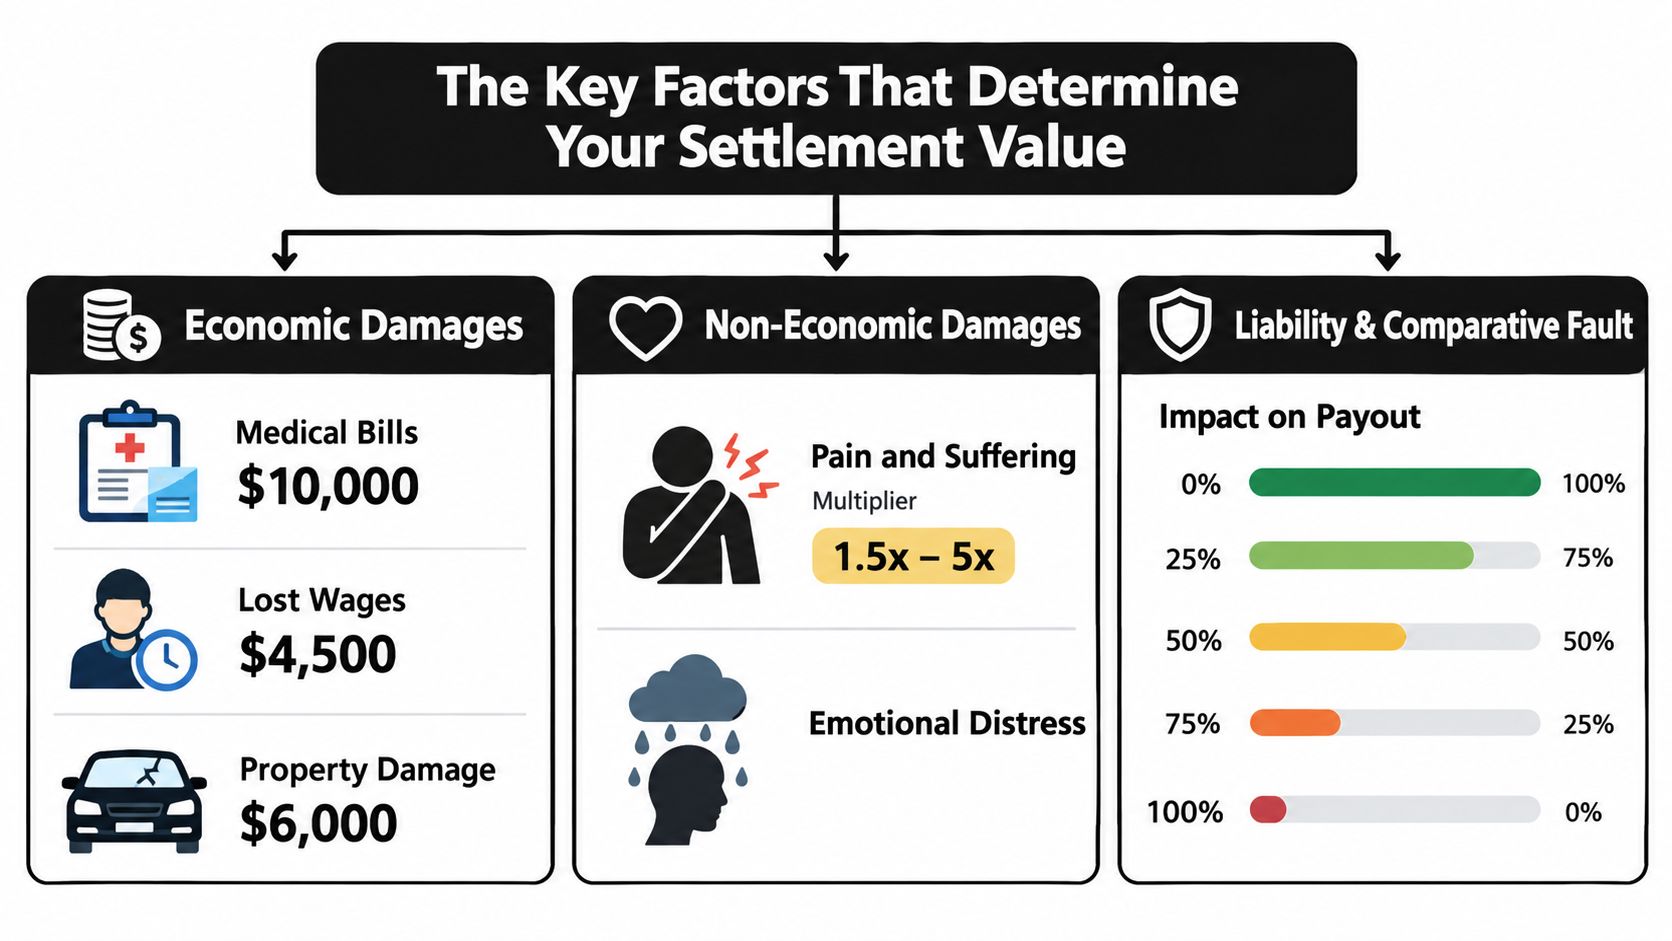
The Key Factors That Determine Your Settlement Value
If you want a cleaner way to think about value, break the claim into a few separate parts. That keeps you from over-focusing on one number and missing the limiters.
Economic damages
These are the losses you can document most directly. Medical bills, wage loss, out-of-pocket expenses, and property damage usually sit here. If you're trying to separate these from general harm, this guide to special damages in personal injury is a helpful reference.
Property damage matters more than people think. Not because your bumper decides the injury claim, but because vehicle damage often becomes part of the story. If you're trying to understand what your car itself may be worth after the wreck, a tool like used Toyota Camry valuation can help you sanity-check the property side of the loss.
Non-economic damages
Many claim values widen.
Pain, physical limitations, sleep disruption, anxiety, loss of normal activity, and the plain misery of recovery don't come with neat receipts. That's why consumer calculators often oversimplify them. Recent guidance notes that pain-and-suffering estimates can vary widely, with common ranges from 1.5x to 5x medical bills, and much higher in catastrophic cases, depending on severity and proof quality, as discussed in SetCalc's 2026 settlement guide.
A soft-tissue strain with short treatment often compresses toward the lower end. A fracture, surgery, permanent impairment, or documented mental-health impact can move the number much higher.
Practical rule: The more your records show duration, intensity, and disruption, the less your case looks like a routine sore-neck claim.
Liability, comparative fault, and policy limits
Many people lose track of reality.
You might have strong damages and still collect less than expected because fault is split or the at-fault driver carries limited coverage. That's why two similar injury files can settle very differently. One has clear liability and solid limits. The other has disputed lane usage, a recorded statement problem, or a small policy.
Recent market commentary also shows the claims environment has changed. A summary of late 2025 and 2026 trends notes that bodily injury payouts surpassed physical-damage payouts for the first time in 2025, while personal auto costs were still rising in some states and stabilizing in others. That broader context appears in Verisk's personal auto trends discussion, and it helps explain why reserve pressure and claim conditions can affect negotiation behavior.
How to Estimate Your Damages With a Simple Method
A simple estimate works best when you treat it like a worksheet, not a promise. You're building a reasonable range.
Start with the hard numbers first.
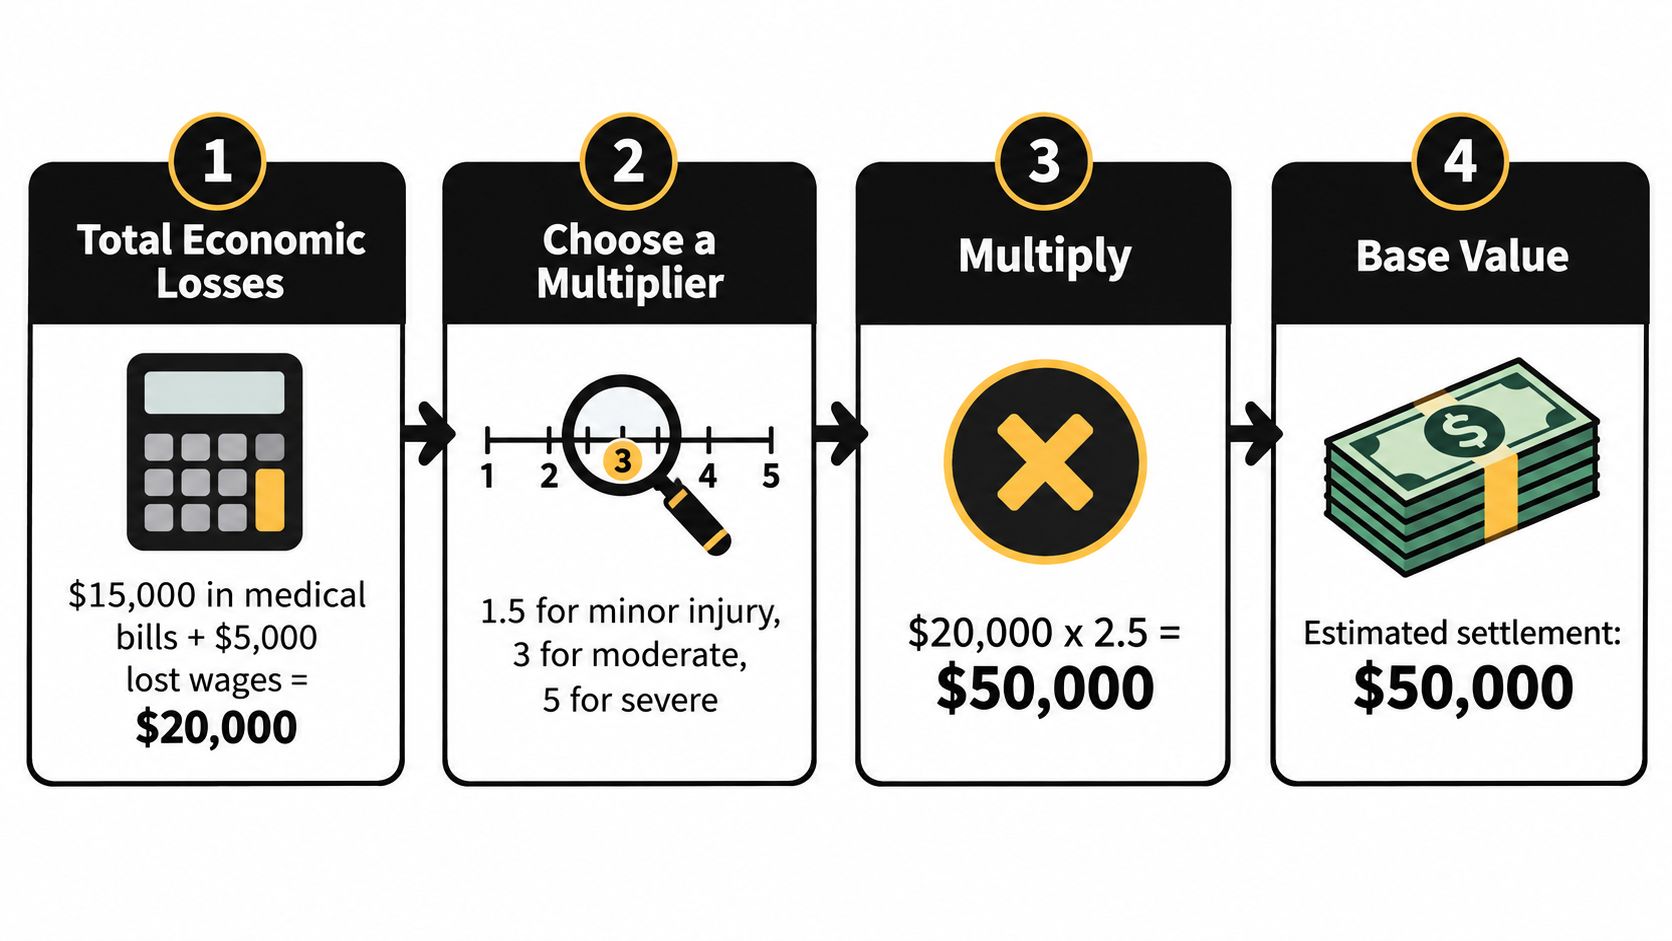
Step 1: total your economic losses
Add up the losses you can support with records:
- Medical bills: ER, imaging, specialist visits, therapy, prescriptions, follow-up care.
- Lost income: missed work, reduced hours, lost contract work.
- Out-of-pocket costs: travel to appointments, braces, medications, replacement help at home if documented.
- Property loss: repair or total-loss value, if part of your broader estimate.
Don't guess. Use statements, wage records, and receipts.
Step 2: choose a pain-and-suffering range
People usually overshoot or undershoot. A better question than “what multiplier should I use?” is “what do my records support?”
Recent guidance places common pain-and-suffering ranges at 1.5x to 5x medical bills, with more severe cases potentially going beyond that. If you want a deeper breakdown of how lawyers think through that part, this article on how to calculate pain and suffering damages lays out the logic clearly.
A rough way to estimate it:
- Lower end: short treatment, mild findings, full recovery.
- Middle range: longer treatment, stronger symptom history, meaningful life disruption.
- Higher end: surgery, permanent limitations, lasting pain, visible impairment, documented mental-health impact.
Step 3: apply the multiplier to the right facts
Here's a simple worked example, using rounded figures rather than pretending anyone can price a case to the dollar this early.
Say your file shows:
- medical treatment with clear records,
- time missed from work,
- continuing symptoms over a sustained period.
You total the economic damages first. Then you choose a low and high multiplier based on how convincing the treatment history is, whether the injury resolved, and whether the records support future care.
This explainer video helps if you want to see the process laid out visually:
Step 4: reduce for fault and cap by available insurance
This last step is where many self-estimates break down.
If you're partly at fault, your likely recovery may shrink. If the at-fault driver has limited coverage, your practical recovery may stop there unless other coverage applies. So your paper value and your collectible value may be very different numbers.
A strong damages package can still settle low if coverage is thin. A modest injury case can settle better than expected if liability is clean, treatment is organized, and the policy is adequate.
When firms build demands, they usually don't rely on memory alone. They organize medical chronology, diagnoses, providers, and gaps first. Tools such as Ares are used by PI teams for medical record review and demand drafting so the valuation ties back to page-cited facts instead of a loose narrative.
Example Calculations and Realistic Value Ranges
Two people can walk away from the same rear-end crash with similar soreness, similar vehicle damage, and similar medical bills. One claim settles in the low four figures. The other lands much higher. The difference is often not the crash itself. It is the proof, the fault picture, and the coverage available.
The table gives you a starting frame. The mini-example after it shows how the numbers can separate even when the collision facts look almost identical.
Example Auto Accident Value Ranges by Injury Profile
| Injury Scenario | Economic Damages | Multiplier Applied | Estimated Total Range |
|---|---|---|---|
| Minor soft-tissue injury with short treatment and full recovery | Lower documented medical and wage loss | Lower end of the common range | Often below or around typical routine-claim benchmarks |
| Fracture or more serious injury with extended treatment, missed work, and stronger pain evidence | Moderate to substantial documented losses | Middle to higher range depending on permanence and chronology | Often above routine benchmarks and can move well into higher settlement territory |
| Catastrophic impairment with permanent limitations and future care | High documented losses plus ongoing support needs | Can exceed common routine ranges because catastrophic cases are valued differently | Frequently far above ordinary claim benchmarks, subject to proof and collectible coverage |
Here is a concrete example.
Driver A and Driver B are both rear-ended at a stoplight. Each has $6,000 in medical bills and $2,000 in wage loss, so each starts with $8,000 in economic damages. On paper, that looks like the same case.
Driver A treats consistently for ten weeks, has clear chart notes showing reduced range of motion and headaches, and misses work with employer verification. Liability is clean. A modest pain-and-suffering multiple could place the paper value around $16,000 to $24,000 before any coverage limits are applied.
Driver B has the same bills, but waits three weeks to start care, misses appointments, has sparse records, and posts no wage documentation. The insurer also argues Driver B stopped short and shares some fault. That same $8,000 base can shrink quickly. A lower non-economic assessment, plus a fault reduction, may pull the realistic range down to roughly $8,000 to $12,000.
That is how valuation works in practice. The bills may match, but the file does not.
What these examples show
A short soft-tissue claim often stays compressed because insurers question duration, causation, and how much daily life was disrupted. A fracture, surgery, or imaging-confirmed back injury usually creates a different settlement discussion because the records show a harder recovery path and a clearer medical story.
Recent insurer payout trends have also shifted older assumptions upward, but not evenly. Stronger claims with organized treatment records and adequate policy limits have more room to grow. Claims with thin documentation, shared fault, or low limits still get squeezed, even in a market where average payouts have risen.
Policy limits matter more than many injured drivers expect. A case may carry a paper value of $40,000 and still settle near a $25,000 bodily injury limit if no other coverage applies. Comparative fault can compress value the same way. A 20 percent fault finding cuts a $20,000 case to $16,000 before you even reach the coverage question.
Where your own case may fit
Match your case to the right lane. If your injury involves ongoing back pain, disc problems, injections, or months of treatment, compare it to cases with that same medical pattern, not to a brief urgent-care sprain. This overview of back injury settlements from a car accident gives a more useful comparison point.
The closest comparison is usually the claim with similar records, similar treatment length, similar fault issues, and similar insurance limits. That is what expands or compresses value in real files.
Practical Tips to Document and Protect Your Claim Value
A claim often loses value in ordinary ways. The ER bill is missing. The physical therapy gap is never explained. The photos stay on a broken phone. An adjuster does not need proof that you are exaggerating. Unanswered questions are often enough for them to discount the file.
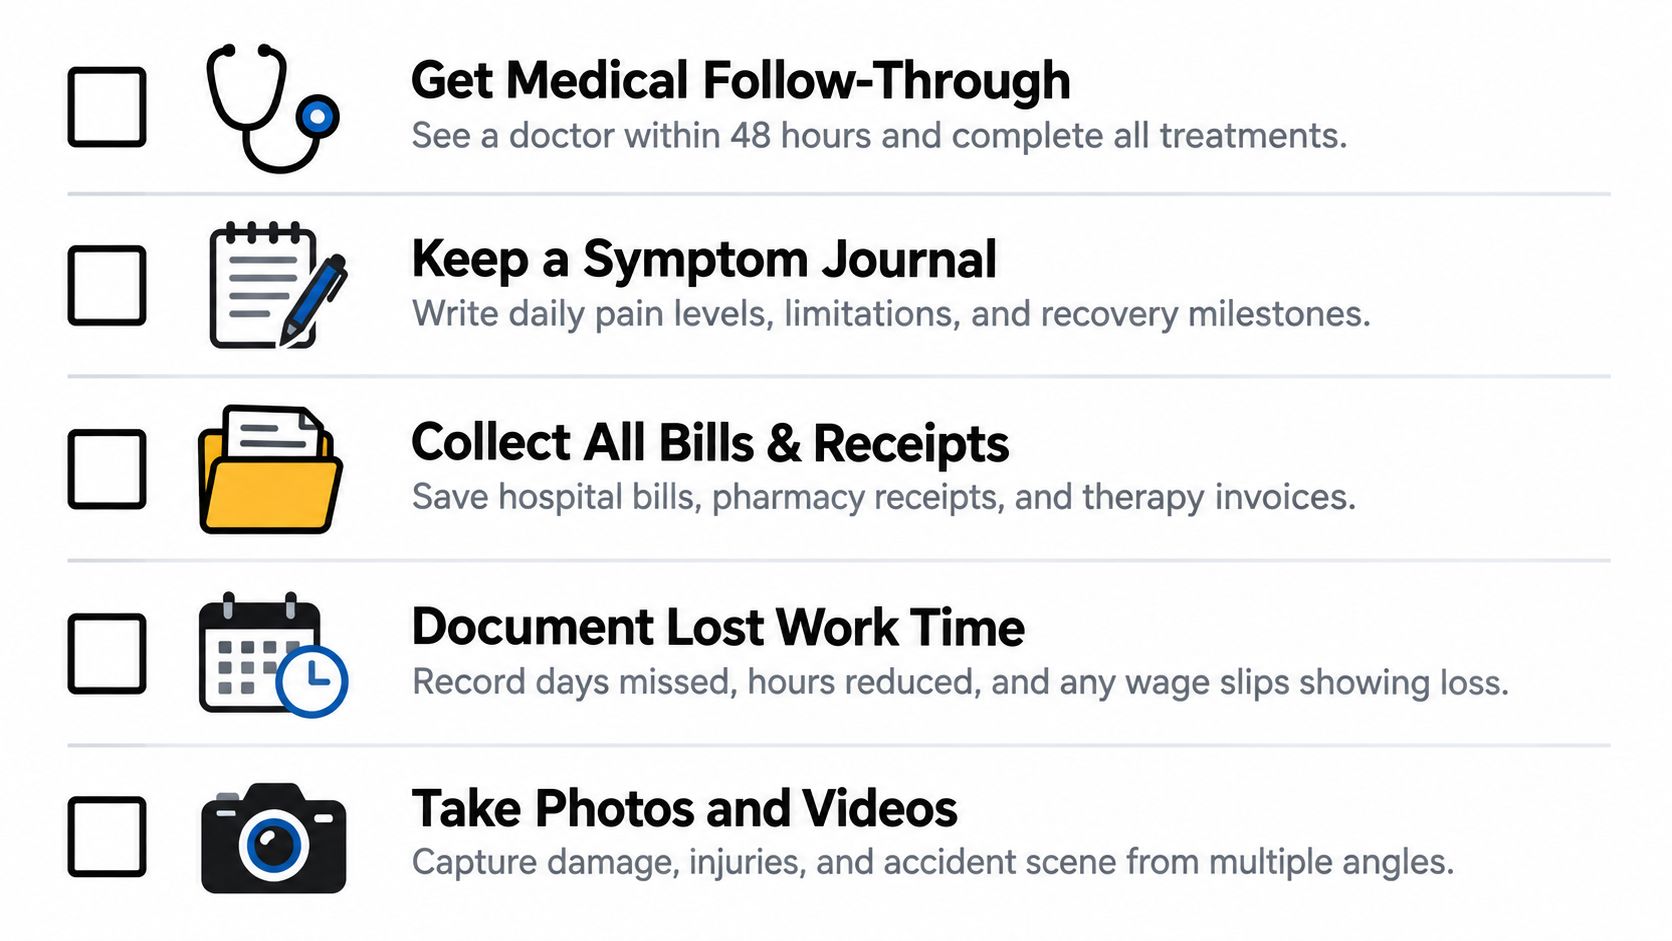
Documentation works like receipts for the parts of recovery no one else can see. Good records do not automatically raise a case above the available policy limits or erase comparative fault, but they do help you protect the value that is there. In a tighter claims environment, the better-documented file usually gets a more serious review than the claim built on memory alone.
What to do this week
- Follow through with care: Start treatment as soon as you reasonably can and attend the appointments your providers recommend. If you have to miss visits because of cost, transportation, or work, ask that reason to be noted in the chart.
- Keep a symptom journal: Write short daily notes about pain, sleep disruption, headaches, driving anxiety, lifting limits, and missed family or work activities. A few honest lines each day are usually more useful than trying to rebuild three months of symptoms from memory.
- Save every bill and receipt: Keep hospital bills, pharmacy receipts, therapy invoices, mileage logs, medical equipment purchases, and over-the-counter items your providers told you to use.
- Document wage loss clearly: Get written confirmation of missed days, reduced hours, job-duty changes, or used PTO. Lost income is easier to prove when payroll and attendance records match your story.
- Preserve digital evidence: Save photos of the scene, vehicle damage, bruising, casts, swelling, and mobility aids. Keep screenshots of texts, work messages, rideshare receipts, and calendar entries that show how the injury affected your routine.
What insurers often use to discount value
Adjusters usually look for breaks in the story. If the medical records, photos, work records, and your own statements point in different directions, they argue the claim is less reliable.
Common problems include:
- Recorded statements given too early
- Social posts that conflict with the claim
- Treatment that starts and stops without explanation
- Records that mention prior pain but do not distinguish the crash-related change
- Mental-health symptoms that are real but never documented
One point causes confusion in many files. Prior injuries do not automatically ruin a case. What matters is whether the records clearly show what changed after this crash. If your neck hurt once a year before, but now you cannot sit through a workday or drive without flare-ups, your records should say that plainly.
The goal is simple. Build one consistent paper trail so the adjuster can follow the same story from the crash scene to the last treatment visit. That does not guarantee top dollar, but it reduces the gaps insurers use to compress claim value.
Next Steps to Get an Accurate Valuation for Your Case
If you're asking how much your auto accident is worth, start with a grounded estimate. For many routine claims, the baseline is often in the tens of thousands, not fantasy numbers pulled from verdict headlines. But your final outcome may still turn on fault allocation, proof quality, and coverage limits more than on any generic calculator.
A self-estimate is usually enough when the injuries are minor, treatment is short, liability is clear, and the available insurance is straightforward. You probably need a professional review when the records show surgery, fractures, lasting symptoms, future care, wage-loss issues, shared fault, or unclear coverage.
Bring the right materials to that review:
- Accident report and photos
- Medical records and billing statements
- Wage-loss proof
- Insurance information
- A timeline of treatment and symptoms
The cleaner your file, the faster someone can tell you whether your own estimate is realistic or too low.
If your firm is evaluating motor vehicle claims, Ares helps turn raw records into organized medical summaries and demand-ready insights so case value is tied to documented facts, not guesswork. For teams handling settlement analysis, chronology review, and damages support, visit Ares to see how the platform fits this workflow.