

Your vendor says the new records-review tool saves eight hours a case. Your paralegals agree the chronologies get done faster. Three months in, a partner asks the only question that matters: did the firm make more money, and can you prove it? If you can't connect saved hours to signed matters, realized fees, or better settlements, you don't have a revenue story. You have a productivity claim.
That's what a proper revenue impact analysis fixes. It separates labor you didn't spend from revenue you created, and it forces every assumption into numbers partners can challenge.
The Six-Stage Framework at a Glance
Say a 12-attorney personal injury firm adopts a records-review tool. The managing partner doesn't ask whether people like it. She asks whether it paid off. Answering that question takes six stages, in order, and each one produces a single artifact you can hand to someone else.
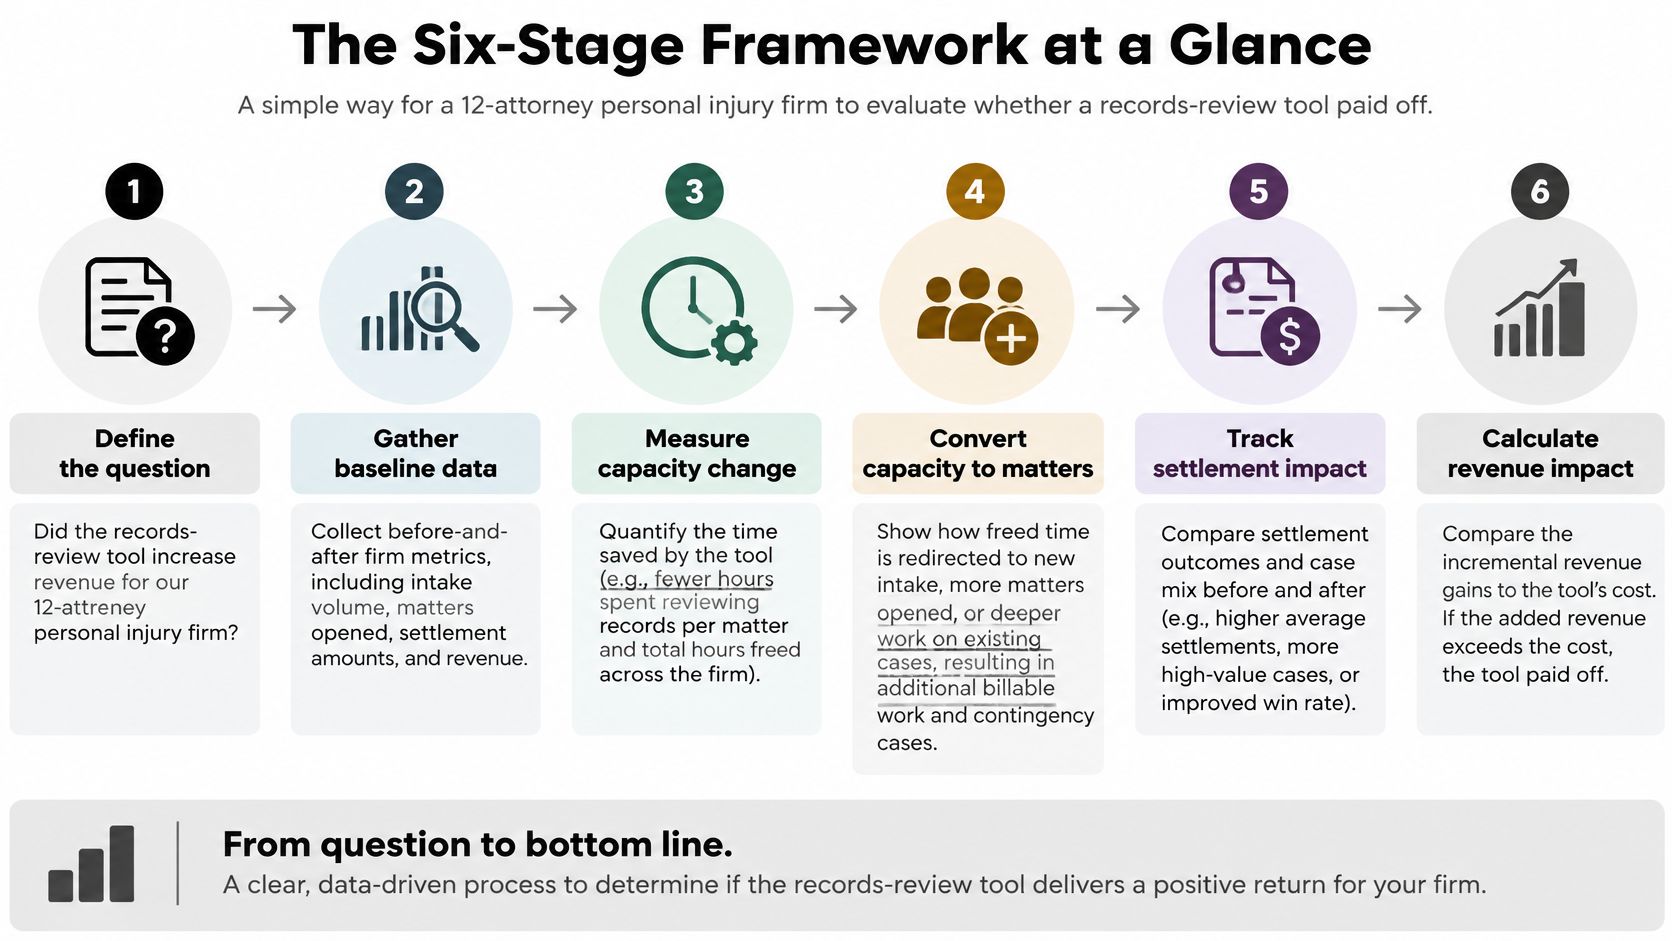
The Six Stages and What Each One Produces
Stage 1, define the metrics, takes about one day. You produce a short metric list with a formula for each item, so nobody argues later about what counts as a signed case or a realized fee.
Stage 2, collect a clean pre-change baseline, takes one to two weeks. The output is three to six months of verified case, time, and billing data from before the change. This is the slowest stage and the one firms most often rush.
Stage 3, calculate time and cost savings, takes two to three days. You get hours and dollars saved per case, broken out by paralegal and attorney time. That's a cost figure, not a revenue figure, and the distinction drives everything after it.
Stage 4, model caseload and settlement changes, takes about one week. Here you estimate incremental signed cases and any settlement-value lift, because released capacity only matters if it converts into matters or outcomes.
Stage 5, build ROI and sensitivity scenarios, takes two to three days. The artifact is an ROI range under downside, conservative, base, and optimistic cases, not a single confident number.
Stage 6, present the decision, takes two to three days. Partners get a one-page decision memo with the ask on the first line and assumptions in an appendix.
Order matters: A missing baseline makes every later number unreliable, no matter how clean the spreadsheet looks.
What You Need Before You Start
Don't begin without three to six months of pre-change case, time, and billing data, plus a written description of the old workflow. If you change the process first and reconstruct the baseline later, you'll argue about memory instead of data.
The whole exercise fits a two-to-four-week project once the data is in hand. The core question stays plain throughout: what changed in cases signed and fees collected, not how many hours disappeared from timesheets.
Defining the Metrics That Count
Good metrics come in two families, and you need both. Lagging indicators show money that already moved: signed cases, realized fees, cost per matter, average settlement value, and net margin. Leading indicators show whether money is likely to follow: records review hours, cases per attorney, and demand-to-settlement days.
Tracking revenue alone leaves you blind for months, because contingency fees arrive long after the work changes. Tracking only activity leaves you with busywork that may never convert. The McKinsey research on customer-analytics adoption found that companies using customer analytics broadly and intensively were about twice as likely to generate above-average profits and marketing earnings as weaker users.
That finding points to a practical rule for PI firms. Connect operational measures like processing time, capacity, and cycle time to financial outcomes like revenue, gross margin, and cost per matter. If review hours fall but signed cases and fees don't move, you've improved a workflow, not the business.
Eight Candidate Metrics
The values below are illustrative placeholders. Replace every one with your firm's own baseline before you model anything.
| Metric | Definition | Type | Illustrative Value |
|---|---|---|---|
| Signed cases per month | New retainers executed in the month | Lagging | 30 |
| Intake-to-signature rate | Signed matters divided by qualified intakes | Lagging | 35% |
| Average fee per matter | Fees realized divided by matters closed | Lagging | $12,500 |
| Cost per matter | Staff, software and overhead divided by matters opened | Lagging | $4,100 |
| Average settlement value | Total settlements divided by cases resolved | Lagging | $68,000 |
| Records review hours per case | Attorney and paralegal hours on medical chronology | Leading | 13 |
| Cases per attorney | Open matters per attorney at month end | Leading | 18 |
| Demand-to-settlement days | Days from demand sent to signed settlement | Leading | 150 |
Rules for Choosing Your Set
I'd pick five to seven of these eight metrics, not all of them. More than seven and nobody owns the numbers. Fewer than five and you'll miss either the money or the mechanism that produces it.
Write each formula before you pull any data. "Average fee" means nothing until you decide whether the denominator is matters closed, matters settled, or matters with fees disbursed. Those choices change the answer, and partners will find the gap.
Split settlement value by case type. Auto, slip-and-fall, and medical malpractice matters behave differently, carry different costs, and resolve on different timelines. A shift in case mix can hide a real improvement or fake one that never happened.
If you already track firm performance, align these definitions with your existing performance benchmarking process instead of inventing a parallel set. One definition per metric, used everywhere, beats three dashboards that disagree.
Pick metrics you'd act on. If a number moved 20% and nobody would change staffing, intake, or spending, drop it.
Collecting a Clean Baseline Before Any Change
A baseline is a documented, dated snapshot of how the firm performed before the change. Without it, you can't attribute anything. You'll have a before picture drawn from memory, and memory always flatters the new tool.
The Seven-Step Baseline Procedure
- Choose the window. Pick a pre-adoption window of six months and record its exact start and end dates. Six months smooths out one odd month without reaching back into a different staffing era.
- Export intake logs. Count qualified intakes and declines, grouped by decline reason. Declines for capacity reasons matter most, because they're the matters released hours could later recover.
- Pull time entries by task code. Separate records review, chronology building, and demand drafting. If attorneys lump these into one code, fix that now, not after rollout.
- Pull closing statements. For every resolved matter, record gross settlement, fee, and case costs. These documents are your ground truth for realized fees.
- Record demand dates. Capture the date each demand was sent, so you can measure demand-to-settlement days consistently.
- Tag every matter. Note case type and handling attorney on each file. You'll need both fields to control for case mix and individual variation later.
- Map the old workflow. Write a one-page description of how records review and demand drafting worked before the change. This page defends the comparison when someone challenges it in six months.
Where Each Figure Lives and What Goes Wrong
| Source | What It Gives You | Watch For |
|---|---|---|
| Case management system | Matter open and close dates, status, case type | Status fields not updated; audit monthly |
| Time and billing records | Hours by task such as records review and drafting | Task codes vary by attorney; standardize before export |
| Intake or CRM logs | Leads, qualified intakes, declines | Decline reasons often missing |
| Settlement and closing statements | Gross settlement, fees, case costs, liens | Gross and net figures get mixed; use net to client and fee |
| Accounting ledger | Staff, software and overhead costs | Allocate shared costs by matter share, not headcount |
| Referral source tracker | Referral volume and referral quality | Seasonality shifts volume month to month |
| Medical records timestamps | Date records were received and reviewed | Often stored in the document system, not the case file |
Two Warnings Before You Trust the Data
If staffing changed during the baseline window, flag those months in writing. A paralegal departure or a new associate can move review hours more than any software. Partners deserve to see that caveat next to the number, not buried in a footnote.
If the window includes a seasonal intake peak, compare it against the same months in the prior year. PI intake isn't flat across the calendar, and comparing a busy spring to a quiet winter will manufacture growth that doesn't exist.
Practical check: Hand your baseline export to a paralegal who worked those files. If the hours and statuses don't match her memory of the work, fix the export before you model.
Freeze the baseline file once it's verified. Any later correction gets a dated note explaining what changed and why. A baseline that mutates is worse than a rough one that stays put.
Calculating Time and Cost Savings
Start with a worked example you can rebuild with your own numbers. Say the firm opens 40 new cases a month. A paralegal's loaded cost is $48 an hour and an attorney's is $140 an hour, loaded meaning salary, benefits, and overhead share combined.
Before the change, each case takes 10 paralegal hours and 3 attorney hours of records review and chronology work. After the change, those figures fall to 4 paralegal hours and 1 attorney hour. The table builds the result line by line.
Worked Example for Monthly Time and Cost Savings
| Line | Calculation |
|---|---|
| Paralegal hours saved per case | 10 baseline minus 4 after = 6 hours |
| Paralegal savings per case | 6 hours × $48 = $288 |
| Attorney hours saved per case | 3 baseline minus 1 after = 2 hours |
| Attorney savings per case | 2 hours × $140 = $280 |
| Gross savings per case | $288 + $280 = $568 |
| Less re-review allowance | 25% of $568 = $142 per case |
| Less software subscription | $3,000 per month ÷ 40 cases = $75 per case |
| Net labor-cost savings | ($426 × 40) minus $3,000 = $14,040 per month |
| Capacity released | 8 hours × 40 cases × 75% = 240 hours per month |
The 25% re-review allowance isn't pessimism. Flagged gaps, missed facts, and human validation send some hours back to your team, especially on multi-provider files. Budgeting for that return trip keeps partners from discounting the whole model when it happens.
Before the subscription, the adjusted labor figure is $17,040 a month. The 240 released hours equal roughly 1.5 full-time equivalents of capacity. Both numbers are real, and neither one is revenue.
The Boundary Most Analyses Cross
That distinction isn't pedantic. The SPI Research findings on AI in professional services report that 84.8% of organizations report value from time savings, while only 29.9% report value through revenue generation. Only 19.1% track AI's effect on billable utilization, and 36.8% do not formally track AI outcomes at all.
For a PI firm, the unanswered question is specific. Did faster medical-record review create additional signed matters, increase cases handled per attorney, improve settlement value, or merely reduce nonbillable labor? Under contingency-fee economics, more output doesn't automatically produce revenue unless the firm accepts better cases, moves them faster, or resolves them for more.
There's a sharper edge here too. Automation may improve profitability without lifting top-line revenue at all. It can even create pricing pressure if clients or referral sources expect efficiency gains to be passed through. That's a margin win, and it's worth having, but call it what it is.
Saved hours are inventory, not income. They sit on the shelf until intake, staffing, or case selection converts them into signed work.
Treat any vendor claim about hours saved per case as a hypothesis, not an input. Verify it on ten of your own closed files, timed by your own staff, before the number enters a model partners will rely on.
Modeling Caseload and Settlement Changes
The test most analyses skip is simple: released capacity creates revenue only when the firm converts it into matters or better outcomes. If intake volume stays flat and attorneys keep the same caseloads, your savings stop at labor cost. Four levers, worked in order, show whether conversion happens.
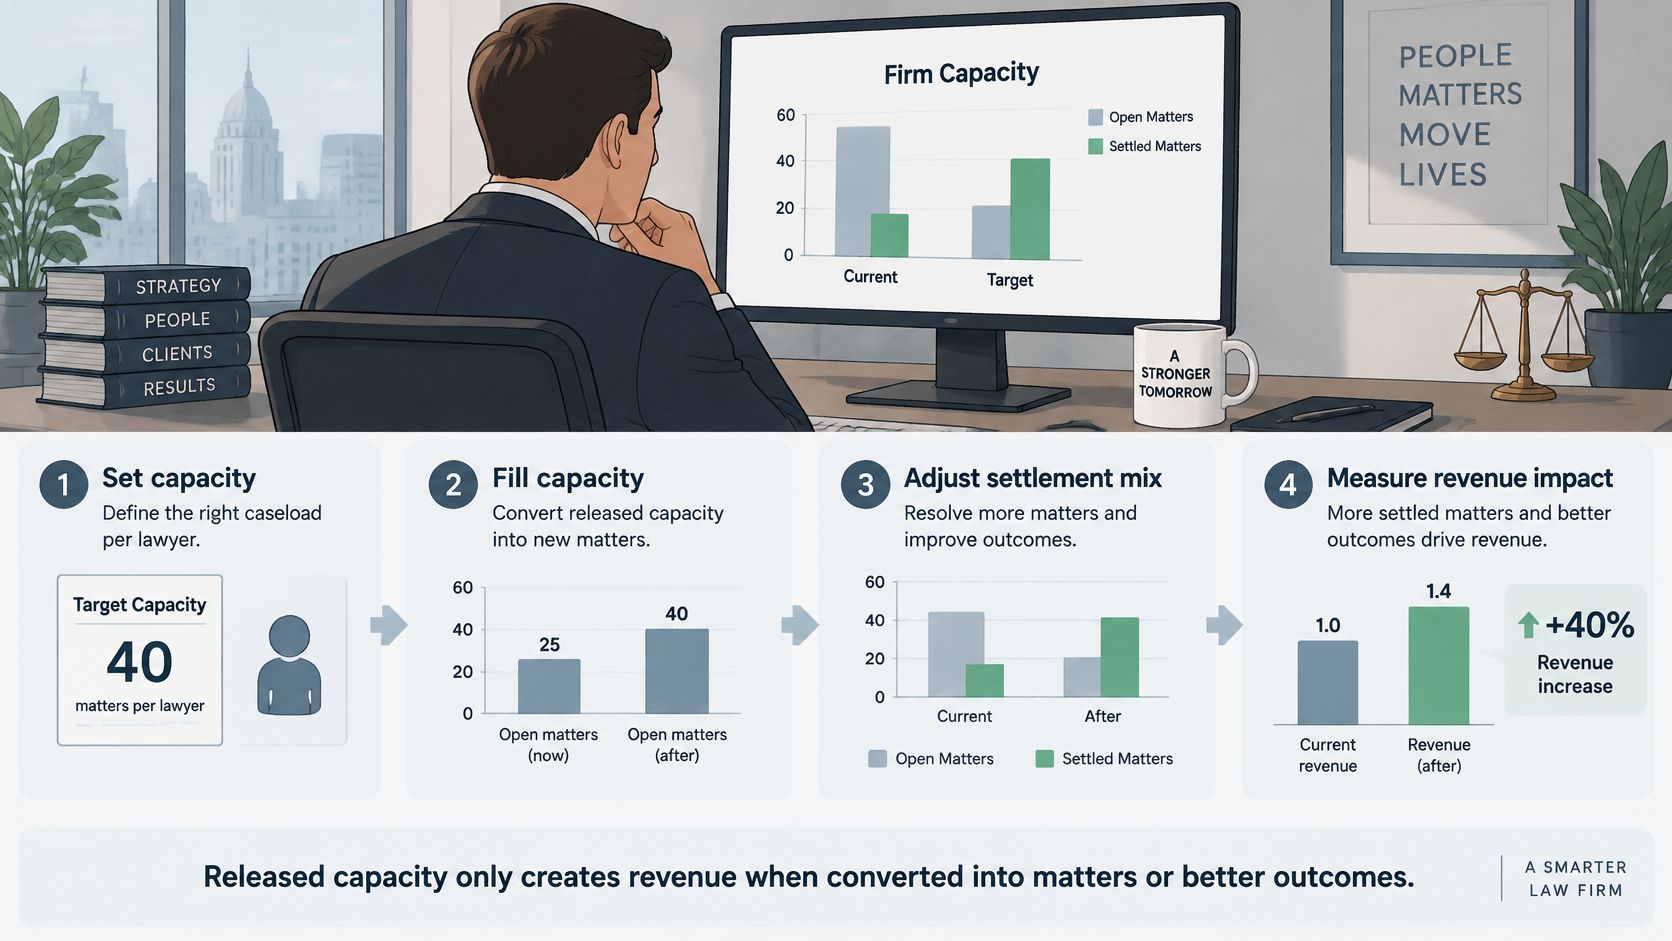
The Four Levers
Lever 1, set capacity. Say one attorney pod moves from 18 active matters per attorney to 22. That's a staffing decision, not a software feature. Someone has to assign those extra files and confirm quality holds.
Lever 2, estimate incremental signed cases. Four extra qualified intakes a month at a 35% intake-to-signature rate yields about 1.4 additional signed matters. Note how much depends on intake supply. Capacity without qualified leads converts to nothing.
Lever 3, convert to fees. Those 1.4 matters at a $12,500 average fee add $17,500 in gross fees a month, before case costs. State it as gross. Partners who discover costs later stop trusting the model.
Lever 4, test settlement lift. A 3% gain in average settlement across 25 resolutions a month is about $51,000 in gross settlements, or roughly $16,830 in fees at a 33% contingency rate. This is the lever I'd present last, because it's the hardest to attribute and the easiest to overstate.
Thoughtful resource allocation decisions determine whether levers 1 and 2 move at all. Freed paralegal time pointed at intake follow-up converts. Freed time absorbed by inbox cleanup doesn't.
Proving the Tool Caused the Change
Attribution is where most revenue impact analysis falls apart. The Thomson Reuters 2025 generative AI in professional services report found that only 20% of professional-services respondents said their organizations were measuring GenAI ROI, while 59% were not measuring it. It also found organizations with visible AI strategies were twice as likely to experience revenue growth as organizations using informal or ad-hoc approaches.
The practical fix is a control comparison. Run the new workflow in one attorney pod and keep a matched pod on the current process. Match on case type and intake volume, then compare review time, case throughput, signed cases, settlement cycle time, and realized fees.
The short video below walks through how structured measurement makes that kind of comparison defensible.
Track demand-to-settlement days alongside the fee numbers. A drop from 150 to 120 days shortens the period your firm carries case costs and expert fees out of its own pocket. That's a cash-flow benefit even when gross settlements don't change.
Watch two edge cases. Referral partners may expect efficiencies passed through in fees or response times, which shifts value away from your firm. And a settlement lift can come from a richer case mix rather than the tool, which is exactly why the control pod exists.
Building ROI and Sensitivity Scenarios
Partners recognize one formula, so use it. ROI equals annual gain minus annual cost, divided by annual cost. Everything else in this exercise is an argument about what belongs in the gain.
Year-one cost in the worked example is a $3,000 monthly software fee plus a $10,000 one-time setup, for a total of $46,000. The gain side uses the $17,040 monthly labor figure before subscription, because the fee is already counted as cost. Counting it twice understates the return and confuses everyone.
Four Scenarios From Downside to Optimistic
| Scenario | Key Assumptions | Annual Gain | ROI |
|---|---|---|---|
| Downside, capacity sits idle | Labor not cashed, no extra cases | $0 | -100% |
| Conservative, labor only | Half of released labor cashed, no extra cases | $102,240 | 122% |
| Base, labor plus extra cases | Conservative plus 1.4 signed matters a month at $12,500, before case costs | $312,240 | 579% |
| Optimistic, base plus settlement lift | Base case plus 3% settlement lift on 25 resolutions a month | $514,200 | 1,018% |
The downside row isn't a formality. Released labor becomes cash only when the firm avoids a hire, cuts overtime, or takes on work it would otherwise decline. If none of those happen, the honest gain is zero and the software is a $46,000 expense.
The conservative row cashes half the released labor: $204,480 × 50% = $102,240 a year. Against $5,520 of net monthly cash after subscription, payback on the $10,000 setup takes about 1.8 months. I'd lead with this row in the partners' meeting and present everything else as upside.
Base adds the 1.4 extra signed matters. Optimistic layers on the settlement lift, worth about $201,960 in annual fees on its own. Both rows are legitimate scenarios, and neither should be your headline.
Sensitivity and Comparable Discipline
Two assumptions move the result most: the share of released labor cashed and the number of extra signed cases. Swing the cashed share from 0% to 50% and ROI moves from -100% to 122% with no other change. Move extra signed cases from zero to 1.4 a month and you add $210,000 of gross fees before case costs.
That's why sensitivity ranges beat point estimates. Show partners which assumption the decision hinges on, then design the pilot to test that assumption first. A structured automation ROI calculation keeps those ranges consistent across tools so you can compare vendors on equal footing.
The same discipline applies outside software. Firms that track marketing spend with the rigor described in a lawyer's guide to advertising returns from LegalRev already understand cost per signed case. Apply that thinking here: every dollar of claimed gain needs a named mechanism and a way to verify it.
If your ROI only works in the optimistic row, you don't have an investment case. You have a hope with arithmetic attached.
Take the Go or No-Go Decision to Partners
Structure the presentation as a one-page memo followed by a short appendix. Partners decide from the first page. The appendix exists so a skeptical partner can audit the math without derailing the meeting.
Lead With the Conservative Answer
Open with the number you can defend: a $102,240 annual gain, 122% ROI, and payback of about 1.8 months, then state the decision requested. Don't bury the ask under methodology.
Show the three levers in plain numbers. Separate cash labor savings from capacity converted into matters and from settlement lift, so partners see which dollars are cashed and which are upside. Mixing them into one gain figure is how credibility dies.
Put every assumption in a table with an owner and a data source. The intake manager owns the signature rate. The managing attorney owns review hours. Finance owns loaded hourly costs. When a number is challenged, a named person answers for it.
The Pilot Ask and Go Thresholds
Make the ask specific. I'd request approval for a 90-day pilot on one attorney pod, running the new workflow on that pod's incoming records review and demand drafting while a matched control pod keeps its current process.
Set thresholds the pilot can test in 90 days:
- Records review hours: Down at least 40% against the control pod, measured from task-coded time entries.
- Cases per attorney: Up 10% in the pilot pod without an increase in re-review corrections.
- Settlement value: Flat or higher on matters resolved during the pilot, split by case type so mix shifts don't fake a result.
Report fee results on open matters at a later checkpoint. Fees arrive as cases close, and most pilot matters won't close inside 90 days. Promising a fee verdict on that timeline guarantees a misleading answer.
Avoid three presentation errors. Don't claim revenue from hours saved. Don't show only the optimistic scenario. Don't present results without a control group. And treat every vendor time-savings claim as a hypothesis the pilot must confirm on your files, with your staff, at your quality bar.
We approve a 90-day, single-pod pilot with a matched control, judged on review hours, caseload, and settlement value, with a go or no-go vote at the next partners' meeting.
Close with the reporting commitment: who publishes the pilot numbers, on what date, and what result triggers rollout, renegotiation, or cancellation. A decision without a review date turns into a subscription nobody owns.
If your firm is running this analysis on records review or demand drafting, Ares automates both workflows for personal injury practices, turning medical records into organized chronologies and case-ready demand drafts. Pilot it on one attorney pod against a control, measure review hours, signed cases, and settlement value for 90 days, and let your own baseline decide whether it earns a firm-wide rollout.