

More than half of claimants in one large survey received a fraction of the reported average payout, and that gap is the most important fact in any discussion of negligence settlement amounts. The average describes a distribution shaped by a small number of severe cases, not the outcome a typical claimant should expect. A useful valuation asks where a specific claim sits in that distribution after liability, venue, injury severity, insurance limits and evidence quality are considered.
Why Headline Settlement Averages Mislead Most Claimants
A headline average promises precision it can't deliver. A 2025 survey reporting a $52,900 average payout also found only 15% of respondents received more than $75,000, while more than half received between $3,000 and $25,000. A separate dataset described in that reporting placed the average near $55,056 across 5,861 settled cases and the median near $31,000, a spread that tells you outliers are pulling the mean upward.
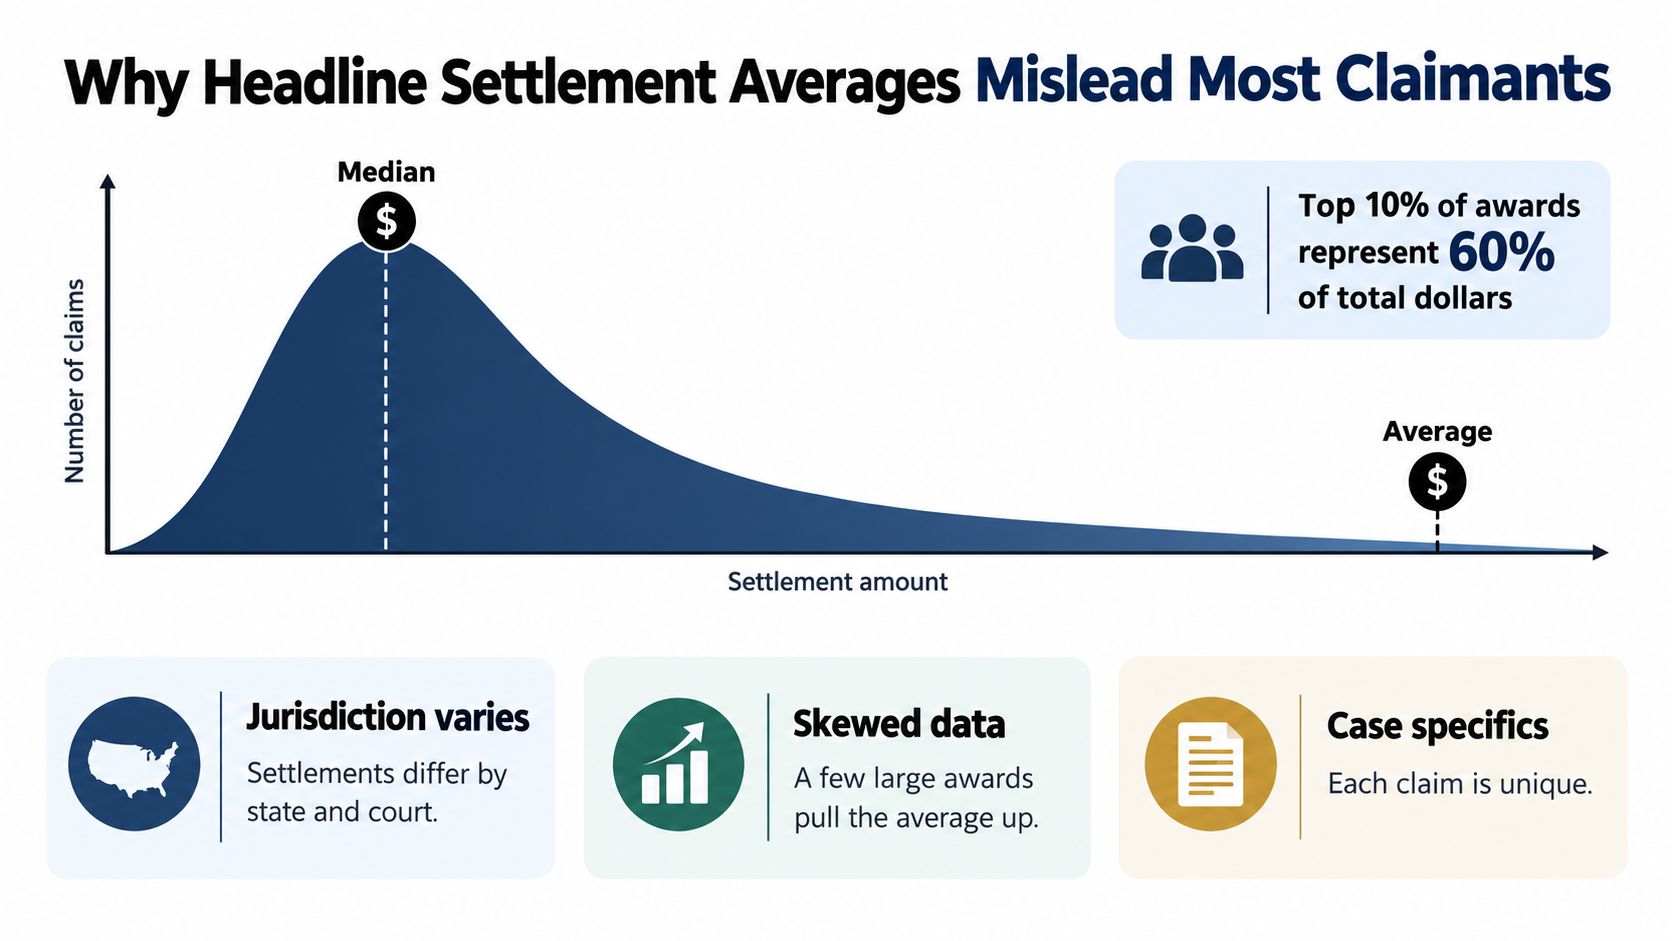
The Median Tells a Different Story
The median is the midpoint where half of outcomes fall below and half fall above. The mean adds every outcome and divides by the number of cases, so catastrophic injuries can inflate it even when most claims resolve modestly. That's why percentile placement is more decision-useful than either figure alone.
Ask three questions before quoting any range to a client. First, is liability clear, disputed or shared? Second, does the medical record connect treatment to the incident without unexplained gaps? Third, what policy limit caps recovery regardless of damages?
Practical rule: Quote a percentile range tied to comparable facts, never a single average detached from venue and limits.
Jurisdiction compounds the problem because filing rules, jury pools and local verdict history differ. A Massachusetts-focused discussion of Brockton auto accident case worth illustrates why local context matters when you're translating national surveys into a case-specific estimate. National data can frame the curve, but it can't place your claim on it.
Selection bias also distorts published figures. Confidential settlements are absent from many datasets, trial awards overrepresent disputed cases, and surveys rely on self-reporting. Gross settlement and net recovery are different numbers too, because fees, costs, liens and subrogation reduce what the client keeps. Treat every headline figure as a starting hypothesis that your evidence must either confirm or move.
What Negligence Legally Requires Before Dollars Attach
No valuation matters until the claim clears four legal filters. If any one fails, the settlement discussion ends or shrinks sharply, regardless of how serious the injury looks.
The Four Element Test
- Duty: The defendant owed the claimant a legal obligation to act with reasonable care under the circumstances.
- Breach: The defendant failed to meet that obligation through action or inaction a reasonable person would've avoided.
- Causation: The breach caused the injury, and the harm was a foreseeable result of that breach.
- Damages: The claimant suffered compensable loss, such as medical expense, lost income, pain or diminished function.
Consider a grocery store slip and fall. The store owes shoppers a duty to keep floors reasonably safe and warn of known hazards. Leaving a spill unaddressed after staff knew or should've known about it may show breach, but you still must connect the fall to the diagnosed injury and document resulting losses.
That connection is where many files weaken. Pre-existing degeneration, prior accidents and delayed treatment give insurers alternative explanations. Attorneys who build a clear causation record from contemporaneous treatment notes reduce room for those arguments before negotiation begins.
A Fast Viability Check
Run this check before drafting a demand. Can you name the duty in one sentence? Can you point to specific conduct showing breach? Does a provider link diagnosis and treatment to the incident date? Can you document each category of loss with records rather than assertion?
If you can't explain causation without speculation, the adjuster won't price the claim as if causation were proven.
Comparative fault adds another filter in many jurisdictions. Shared responsibility can reduce recoverable damages and changes settlement math even when all four elements are present. Identify that risk early, because it affects your percentile placement, your opening position and the client's net expectations.
The Four Forces That Move a Negligence Settlement Up or Down
Four variables explain most movement in negligence settlement amounts. They interact, so weakness in one can cancel strength in another.
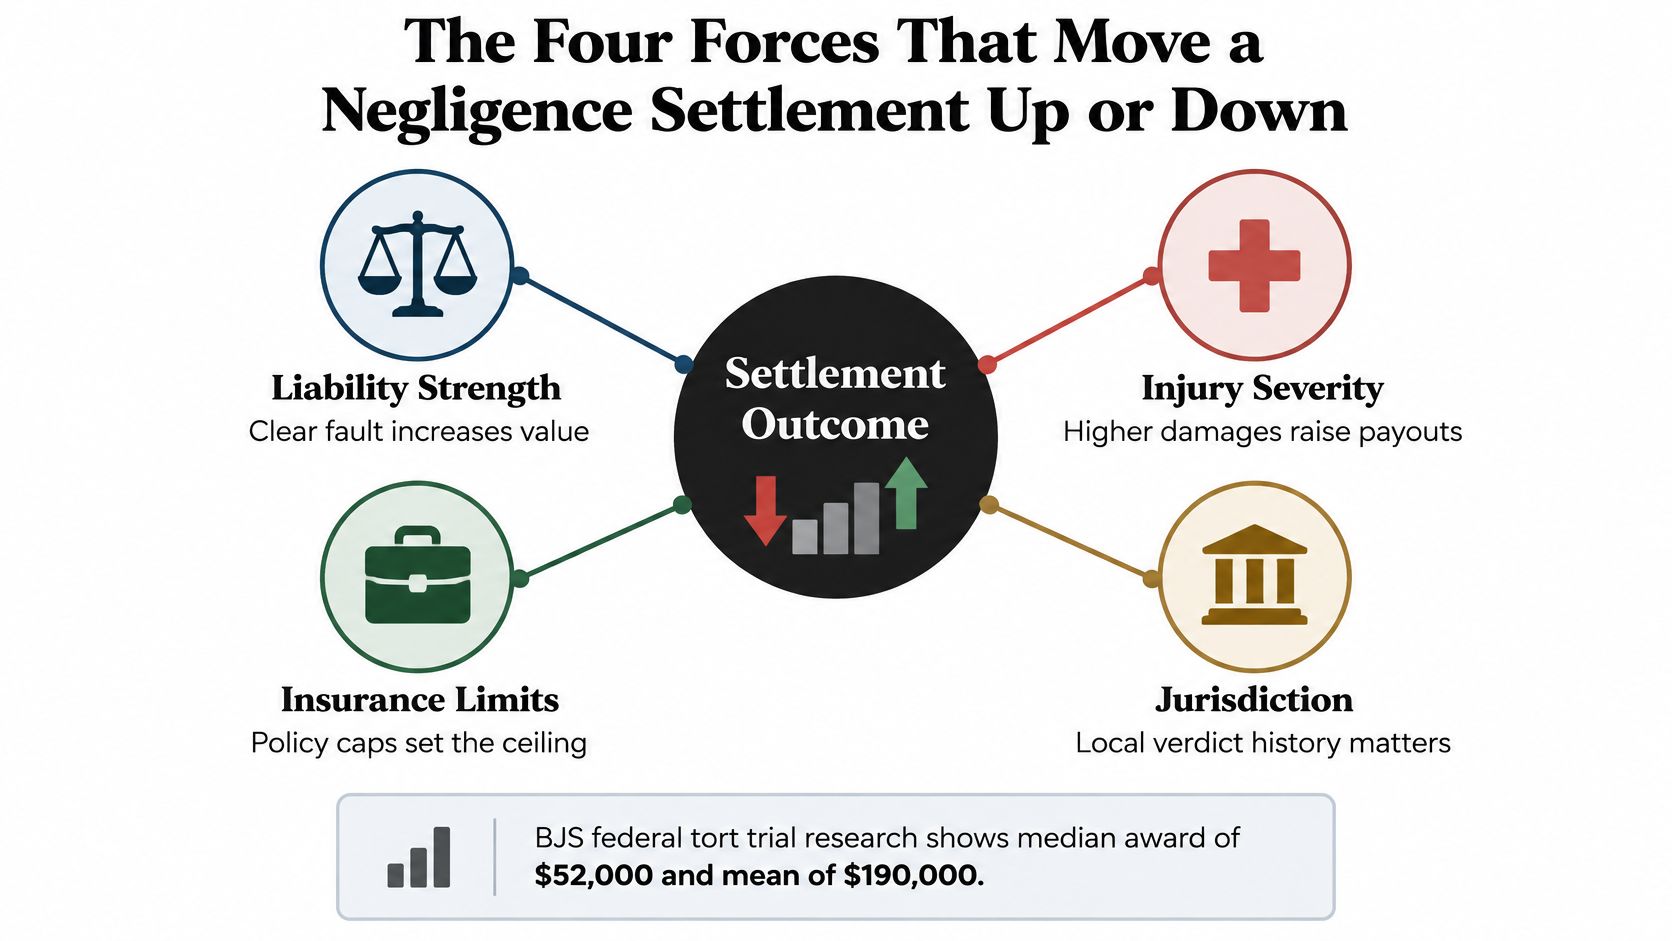
Historical trial data shows why forum and case type matter, even though trial awards aren't settlement averages. In federal tort trials during fiscal years 2002 to 2003, plaintiffs won 48% of cases, 84% of winners received monetary damages, the estimated median award was $201,000, and personal injury trials produced a $181,000 median. Roughly 9 out of 10 of those federal tort trials involved personal injury issues, according to the same source.
Severity and Liability
Injury severity drives medical expense, duration of impairment and future care needs. A short course of conservative treatment supports a different range than surgery, permanent restriction or life care planning. Severity alone doesn't produce value, though, because the record must tie each intervention to the incident.
Liability strength determines how much of that severity the insurer expects to pay for. Clear rear-end fault supported by a police report and independent witnesses prices differently from a swearing contest at an uncontrolled intersection. Disputed liability functions as a discount on every damages category.
Jurisdiction and Documentation
Jurisdiction shapes the trial alternative that sits behind negotiation. Venue, fact-finder and local award history influence the insurer's reserve because they affect expected defense cost and verdict risk. The federal figures above illustrate the principle, and the state-federal contrast in comparable auto cases later in this article makes it concrete.
Damages documentation multiplies or suppresses the other three forces. Complete billing, wage verification and a defensible projection when you calculate future medical expenses from provider-supported treatment plans give the adjuster auditable inputs. Missing records invite the adjuster to substitute lower assumptions.
Insurance limits cut across all four forces as a hard ceiling in many negotiations. A well documented severe injury can still resolve at available limits if there's no additional coverage or collectible defendant. Confirm limits early so you don't build a theoretical range the claim can't collect.
Reading Settlement Ranges by Injury Severity Band
Severity bands help you locate a claim quickly, but each band anchors to different evidence. Use the table as a diagnostic map rather than a pricing promise.
Negligence Settlement Ranges by Injury Severity
| Severity Band | Typical Medical Specials | Treatment Anchor | Liability Discount | Gross Settlement Range |
|---|---|---|---|---|
| Soft tissue | Lower, mostly conservative care | Short course, resolution documented | Heavy if fault is disputed | Low end of overall distribution |
| Moderate fracture or disc injury | Mid-range, may include injections or specialist care | Extended care with objective findings | Moderate, causation sensitive | Middle bands, wide variance |
| Catastrophic injury | Highest, often future care driven | Ongoing care and life care planning | Smaller effect if liability is clear | Upper tail, often limits driven |
Why Each Band Behaves Differently
Soft tissue claims compress because insurers question duration, necessity and mechanism of injury. Consistent complaints from the first visit, proportionate treatment and documented functional limits matter more than a long list of visits. Gaps in care give the adjuster a simple argument that symptoms resolved or came from another cause.
Moderate fracture and disc claims turn on objective correlation. Imaging alone isn't enough if examination findings, radicular symptoms and treatment progression don't align. When conservative care fails and a specialist documents why escalation was necessary, the claim moves within its band. When records are fragmented across providers, it stalls.
Catastrophic claims are valued against future needs rather than past specials alone. Life care plans, vocational analysis and household service losses can dwarf bills already incurred, and policy limits frequently become the binding constraint. Guides that help clients navigate your injury claim are useful background, but catastrophic files need expert-supported projections that an adjuster can audit line by line.
Diagnostic question: Which single missing record, if supplied tomorrow, would most change this claim's band placement?
That question keeps teams from treating the table as a calculator. Bands describe where similar claims cluster. Evidence determines where yours lands inside the cluster, and whether it belongs there at all.
Why a Bigger Demand Does Not Always Mean a Bigger Settlement
Raising the demand can shift momentum, but insurers price expected trial outcome, defense cost and procedural risk, not your opening number. An unsupported demand can slow negotiation by signaling that the file isn't ready for serious evaluation.
The visual below summarizes how an inflated opening can lose force once an adjuster tests it against records and reserve authority.
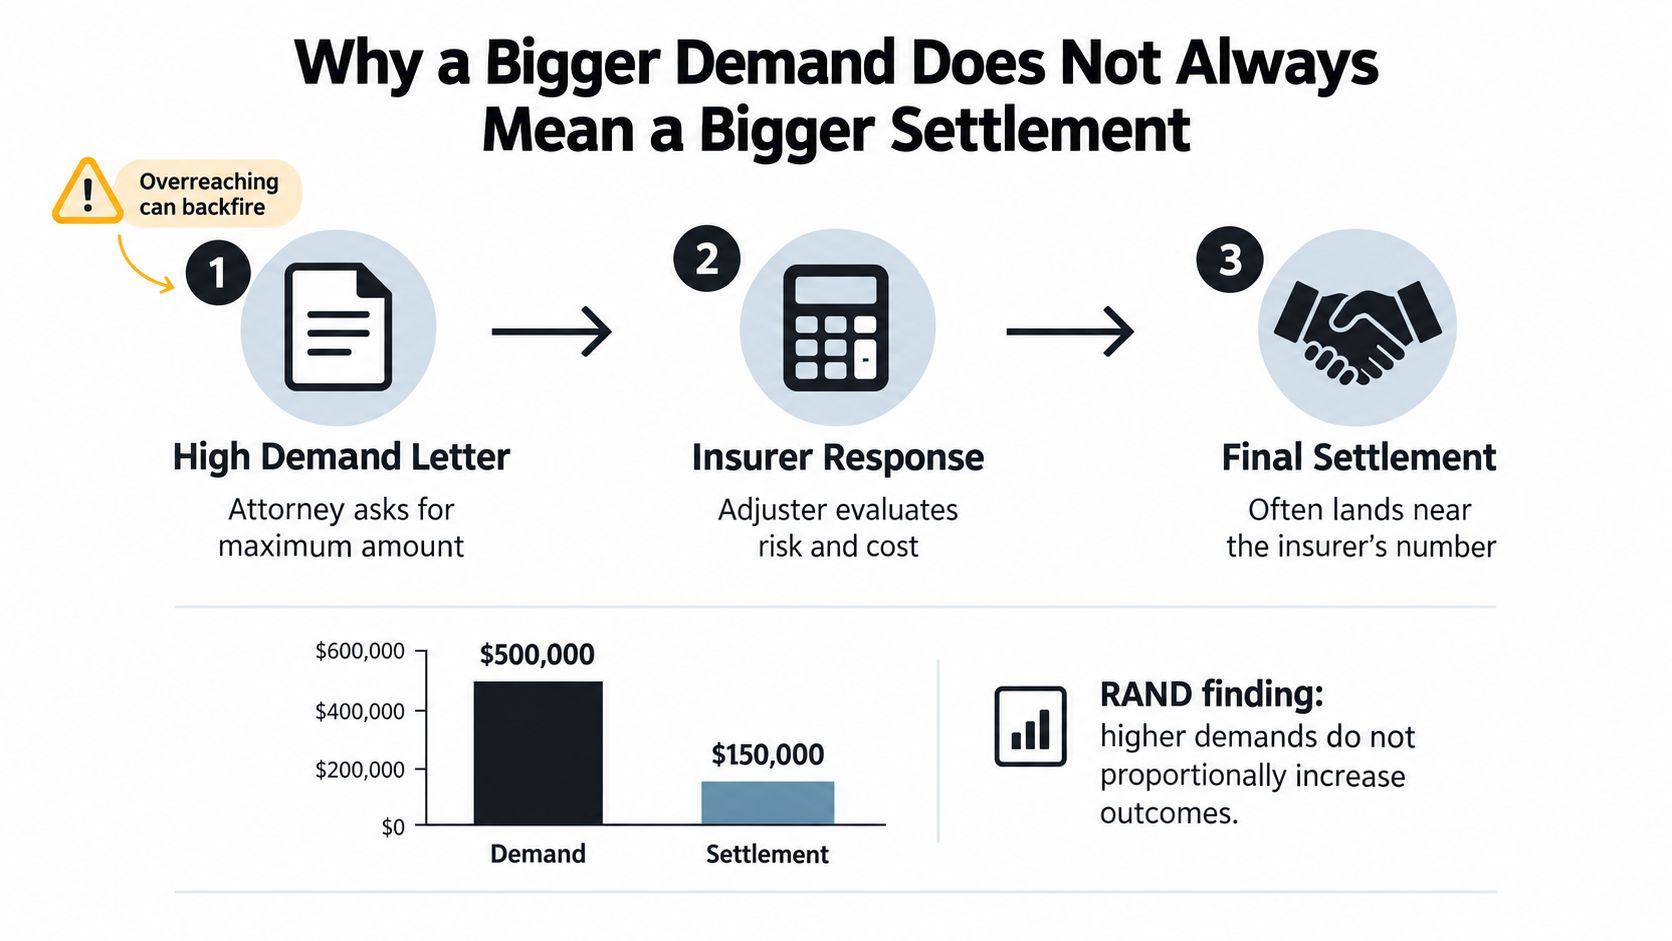
Procedural Leverage Changes Payment Behavior
California history offers a clean demonstration that legal environment moves money independent of injury. RAND found average compensation for closed California bodily injury claims was 35% below the expected level by 1997 after elimination of the Royal Globe doctrine, and 40% to 65% lower after accounting for attorney representation and reported economic loss. Those are historical regime effects, not a current multiplier, but they prove identical harm can produce materially different negotiated outcomes.
The mechanism is straightforward. Rules and representation change the insurer's expected cost of resisting payment. Complete chronology, documented economic loss and credible liability evidence raise the cost of denial because they survive scrutiny at mediation or trial. A large number without that support does not.
Timing friction adds a second problem. Norton Rose Fulbright's 2025 litigation survey reported pre-trial settlement had become moderately or significantly more difficult over the preceding 12 months. In that environment, incomplete records and unresolved causation disputes don't just lower offers, they delay them, and delay has a real economic cost to an injured client.
This short video walkthrough reinforces how demand strategy and evidence interact during negotiation.
Separate the bottleneck before you move on price. Liability disputes need investigation, causation disputes need provider linkage, and limits uncertainty needs coverage confirmation. Conceding dollars to solve an evidence problem usually leaves both the evidence problem and a lower range in place.
Building a Defensible Settlement Range From Comparable Cases
A defensible range is built, not guessed. The method below converts scattered verdicts and settlements into a percentile band you can explain to a client, mediator or adjuster.

A Repeatable Method
- Select comparables: Choose resolved cases with similar injury, treatment, liability profile and venue, and exclude headline outliers you can't factually match.
- Normalize outcomes: Separate gross recovery from net by accounting for fees, costs, liens and subrogation on each comparable where that information is available.
- Plot percentiles: Arrange outcomes from low to high and identify the lower quartile, median and upper quartile instead of averaging them.
- Stress test collectibility: Cap the realistic range at confirmed coverage unless additional defendants or policies are available.
- Adjust for evidence quality: Move within the band for treatment gaps, pre-existing conditions, comparative fault and future care support.
Venue selection inside step one deserves emphasis because it can dominate the result. State court auto plaintiffs in the 75 largest counties in 2001 won 57.5% of cases with an $18,000 median award and 8.7% reached at least $250,000, while federal auto cases showed a 59.7% win rate, a $100,000 median and 11.6% reached $1 million. Mixing those forums without adjustment produces a range that describes neither.
Applying the Method Without Inventing Precision
Take a moderate cervical disc case with clear rear-end liability as an illustration. You'd gather comparable disc cases in the same venue, sort them into quartiles, then examine whether your client's imaging, examination findings and treatment consistency place the claim below, at or above the comparable median. Next you'd compare that gross band with confirmed limits and calculate net outcomes across the band after contractual fees, case costs and known liens.
The output isn't a promise. It's a structured opinion with visible assumptions, which lets the client see how a records gap or a limits cap changes the answer. That transparency also disciplines your opening demand, because you can explain why it sits where it does relative to the upper quartile.
Update the range when material evidence arrives. A surgical recommendation, a favorable liability admission or a newly discovered prior injury should trigger recalculation, not just a revised negotiating posture.
Negotiation Readiness Checklist Before the First Demand
Most weak first offers trace back to preventable file gaps that were visible before the demand went out. A short pre-demand audit catches them while they're still cheap to fix.
The Pre-Demand Audit
- Medical chronology complete: Every provider, visit date, diagnosis and recommendation appears in sequence, with incident-related care distinguished from unrelated care.
- Treatment gaps explained: Each gap has a documented reason, such as provider scheduling, referral delay or a recorded attempt to return to work.
- Causation language located: Treating providers connect symptoms and restrictions to the incident in their own notes, not only in the demand narrative.
- Wage loss verified: Employer records confirm dates missed, pay rate and any reduced duties, rather than relying on client estimates.
- Lien inventory current: Health plan, government and provider liens are identified so gross-to-net math is credible from the first client conversation.
- Policy limits confirmed: Coverage information is documented, and the demand strategy reflects whether limits or damages are the binding constraint.
- Demand narrative structured: Liability, causation, damages and future needs appear in an order an adjuster can follow and audit.
Chronology work is where teams lose the most time. Tools such as Ares can extract dates, diagnoses, treatments and providers from uploaded records into organized summaries, which case managers then verify against source documents before drafting. Automation doesn't replace judgment, but it can surface gaps earlier than manual review alone.
Sequence matters after the audit too. Practitioners who plan concessions and evidence releases before negotiating a personal injury settlement avoid trading dollars for information they could've supplied at the outset. Decide in advance which additional records you'll send if the adjuster raises causation, and what offer interval would justify involving a mediator.
Send the demand when the file answers the adjuster's likely objections, not merely when treatment ends.
That standard ties the whole valuation together. Percentile placement sets the target, the four forces explain movement inside the range, and readiness determines whether the insurer has any reason to believe your placement. Negligence settlement amounts reward files that make the adjuster's internal justification easy to write.
If your team is spending hours assembling chronologies before it can even price a claim, Ares can turn uploaded medical records into organized summaries and demand drafts that surface dates, diagnoses, treatments and gaps in minutes. Visit Ares to see how faster record synthesis can tighten your settlement ranges and get defensible demands out sooner.